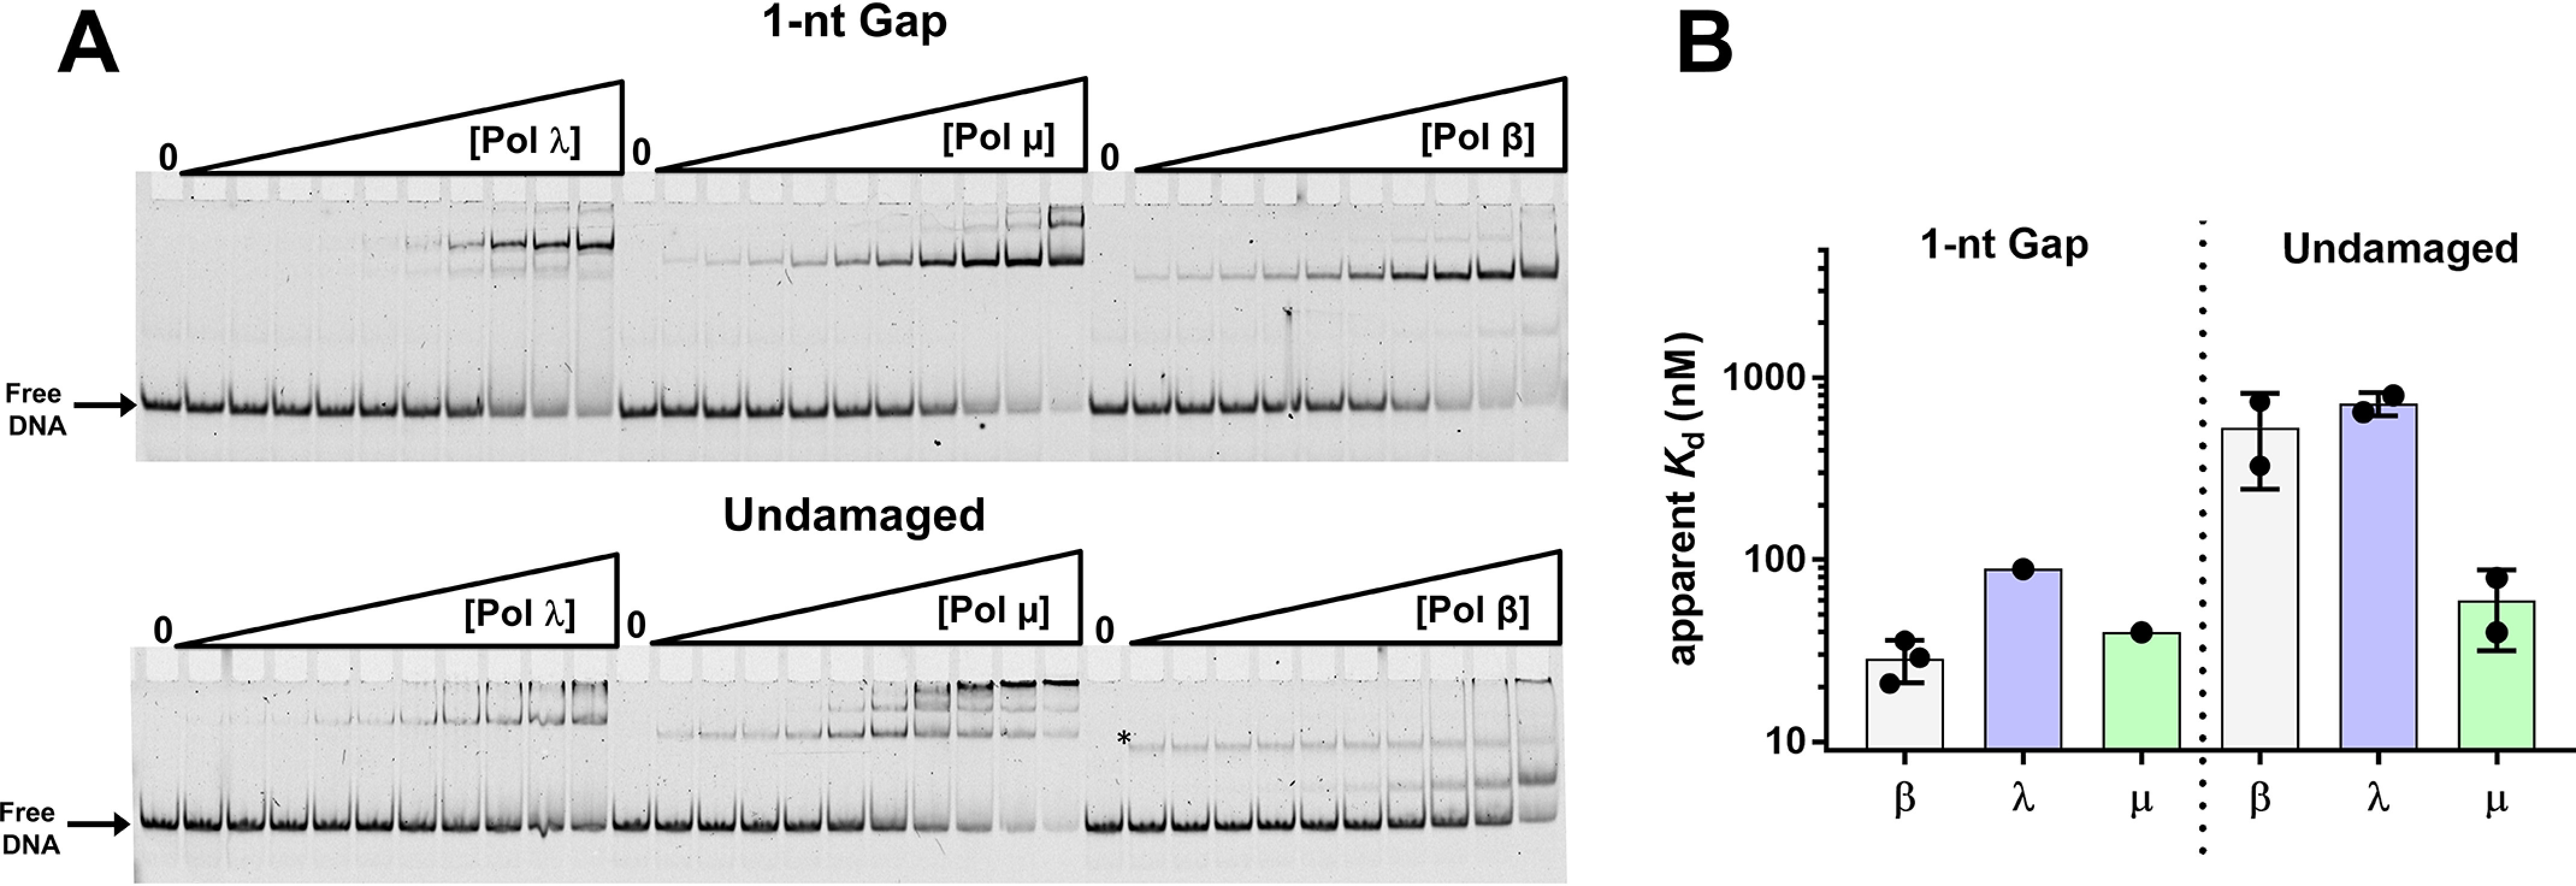
Figure 3.

A, EMSA illustrating binding of pols γ, µ, and β to 1-nt-gap (top) and undamaged (bottom) DNA. Experiments were performed as described in Materials and methods. The asterisk in the reactions performed with pol β and undamaged DNA indicates a band that was not included in the quantification of the gel. Its intensity remains about the same with increasing enzyme concentration and was not observed in other assays under similar conditions (Fig. 2B). B, summary of apparent binding constants of pols to the 1-nt-gap DNA and undamaged DNA. Data in panel A were plotted and fit to a hyperbolic binding equation (Fig. S5 and Table S2).
