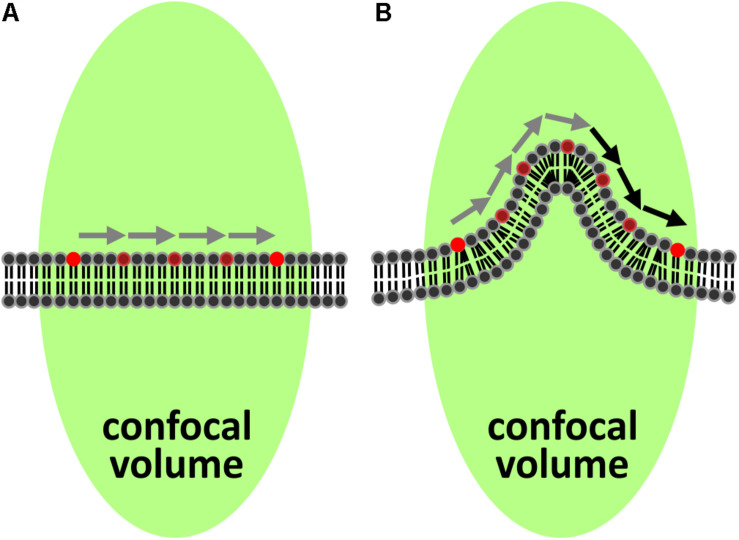
FIGURE 1.
Impact of curved membrane sections on FCS recordings. (A) The most common model for analyzing diffusion in two dimensions with FCS assumes a locally flat membrane aligned perpendicular to the optical axis of the excitation beam (green elongated spot). Gray arrows indicate the length of the path from one side of the excitation spot to the other. (B) If the membrane is locally curved, the path becomes longer (indicated by the additional black arrows) due to the surplus of membrane within the excitation spot, which leads to longer transit times determined by FCS.

