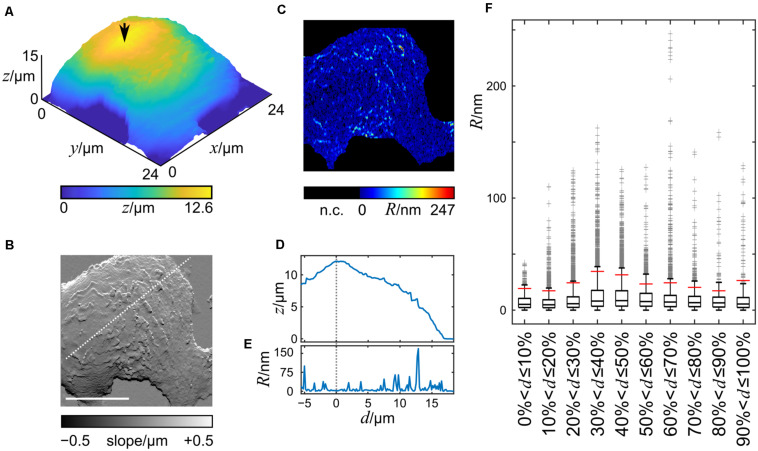
FIGURE 3.
3D-Height and slope representation of a section of a living HT29 cell imaged by SICM. Height and slope representation of a HT29 cell imaged live by SICM is shown in (A,B). (C) Computed roughness of the cell surface. The cell chamber bottom and the steep transitions between the dish and the cell were not considered (n.c.). The arrow in A indicates the position of the reference point. Scale bar in B: 10 μm, also applies to (C). (D) Height and (E) roughness profiles along the dashed white line shown in (B). The vertical dashed line in (D,E) represents the position of the highest point of the nucleus. (F) Box plot of the roughness data grouped into 10 equally spaced groups with increasing distance from the reference point. Boxes indicate the lower and upper middle quartile, whiskers data within ± 1.5 inter quartile ranges, gray crosses indicate outliers.

