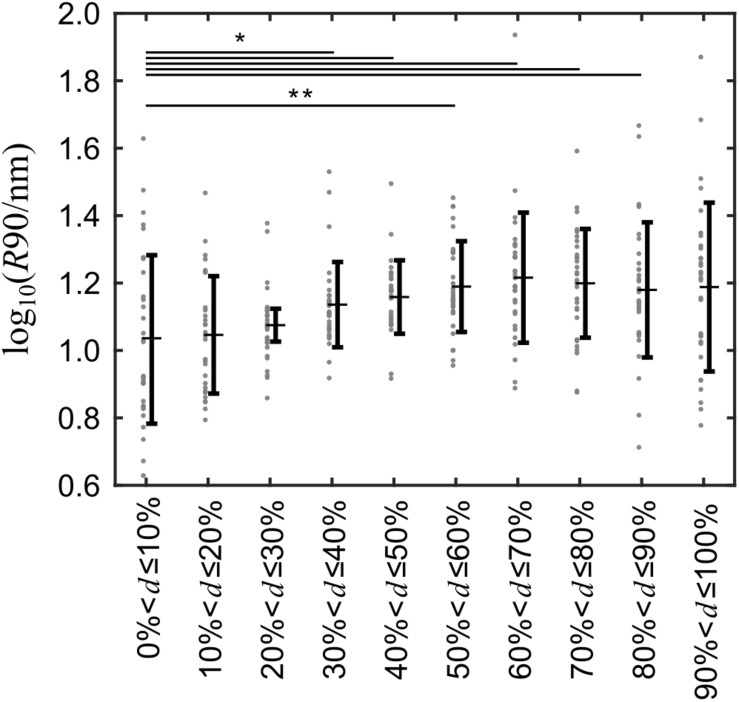
FIGURE 4.
Surface roughness is unevenly distributed over the cell surface and greater away from than at the top of the cells. The cell membrane roughness of 31 different cells was recorded and grouped into 10 evenly spaced groups relative to the spatial dimension of each cell and the log-transformed means of the 90th percentile of the roughness data in each group was compared with a paired t-test. Gray dots indicate the 90th percentile of the cell surface roughness for every cell, horizontal bars with whiskers indicate the mean ± standard deviation. *p < 0.05; **p < 0.01 versus Group 1.

