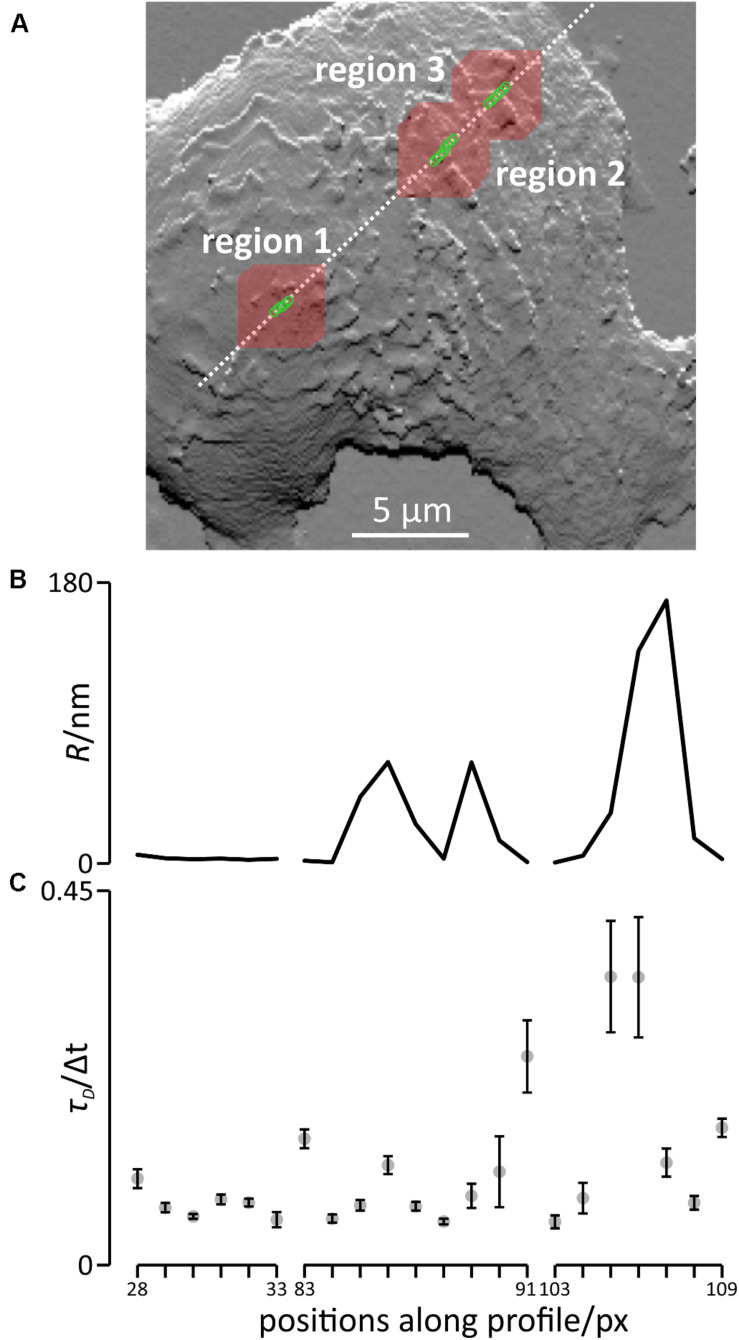
FIGURE 5.
Simulation of diffusion and modeled FCS recordings in the apical part of the membrane of living cells. (A) Positions of the modeled FCS recordings (green circles) and areas in which diffusion was simulated (red squares around each green circles) superimposed on the slope plot of the topography of the plasma membrane (Figure 3B). (B) Roughness of the cell membrane at the positions of the modeled FCS recordings. (C) Transit times presented as means ± SD, n = 5.

