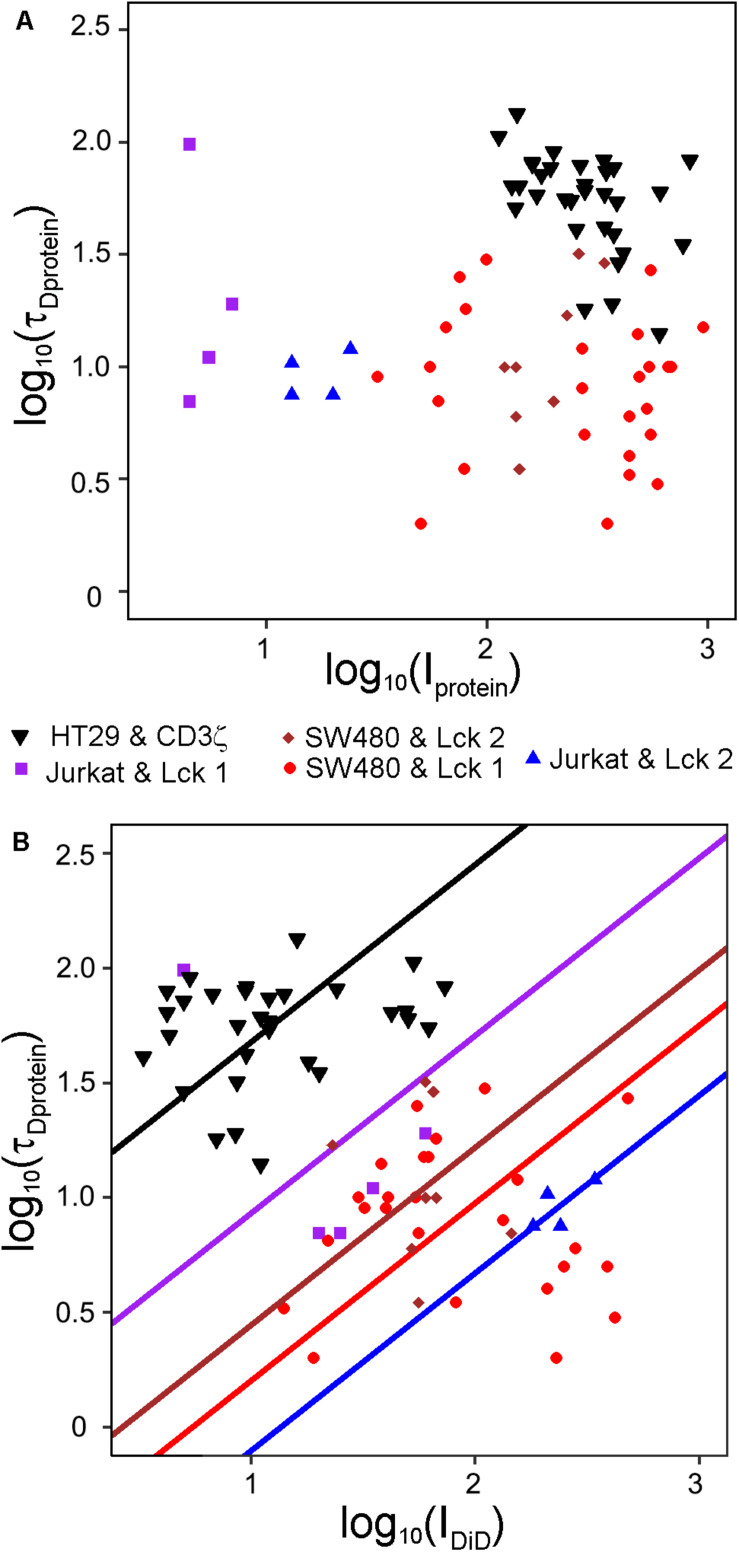
FIGURE 7.
Variations in τD for plasma membrane proteins can be explained by the membrane density in the focal volume. τD and I at the start of FCS measurement were determined for DiD-labeled SW480 and Jurkat T cells transfected with Lck-EGFP or HT29 cells transfected with CD3ζ-EYFP. The FCS measurements were conducted in the plasma membrane above the top of the nucleus, above the cytoplasm midway between the top of the nucleus and the cell edge in the direction the cell had stretched the most and at the basal cell side in touch with the coverslip. Curves were fitted to a model assuming one diffusing species starting the fit at τ = 102 μs. Scatter plots of (A) log10(τD) versus log10(I) for the proteins and (B) log10(τD) for the proteins versus log10(I) for DiD. The values from five different experiments are displayed with different symbols. The lines in B were fitted with least squares in a multiple linear regression model where log10(τD) was the dependent variable and log10 (IDiD) was the independent variable. The mean value of log10 τD conditioned by log10 I shifted between the different experiments, modeled by indicator variables. Random effects for different cells within each experiment were included in the model, but not in the graph. The model had the restriction that all experiments should have the same slope, which was estimated to be 0.77. The variable log10(IDiD) was statistically significant (p = 0.0092), but log10(Iprotein) was not significant (p = 0.16) and therefore no lines were fitted in (A). R2 for the model was 0.83.

