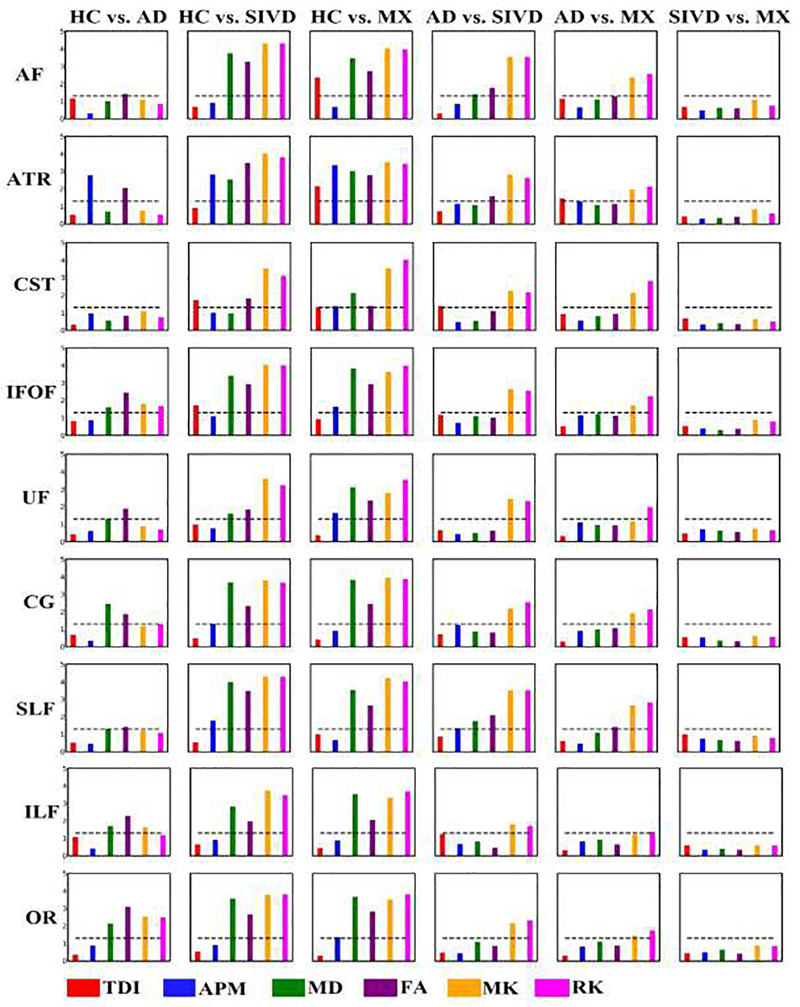
Fig.6.
Results of group differences between pairwise groups using individual features tested on 9 WM tracts. Each column represents a pair of subject groups and each row represents WM tract. Each bar plot is for a specific diffusion feature. Y-axis values plotted were –log10(q-value). (q-value <0.05 is considered significant). Dotted line is an indicator of significant q-value, the bars above which are significant.

