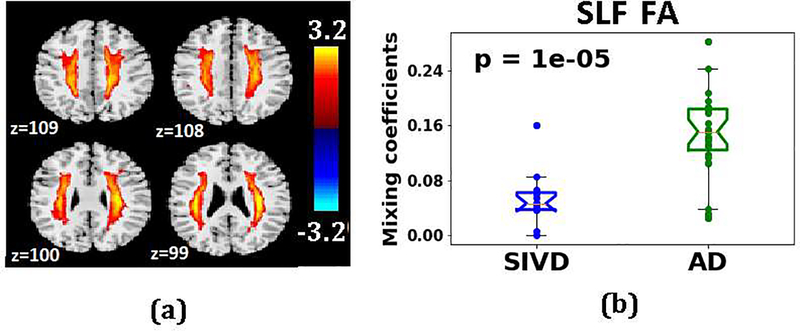
Fig.8.
Result of mCCA+jICA fusion performed between SIVD and AD on 9 features from SLF tract is shown for IC5. (a) Spatial Maps depicting the subregions (red colored voxels) in SLF tract where significant differences using IC5 of DTI feature, FA were seen. (b) Mixing coefficients for IC5 of FA are plotted for SIVD and AD, group testing on the mixing coefficients between SIVD and AD resulted in a p-value of 1e-05. FA values were lower in SIVD compared to AD. Color bar indicates the z-score range of the spatial components.

