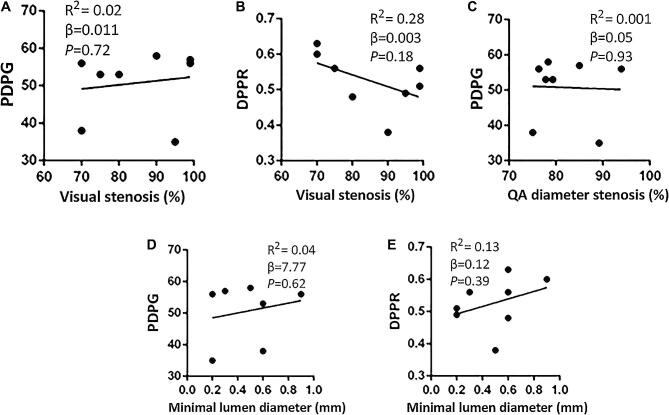
FIGURE 2.
Scatter plots showing nonsignificant correlation between visual percentage of stenosis and PDPG A, visual percentage of stenosis and DPPR B, quantified (QA) percentage of diameter stenosis and PDPG C, minimal lumen diameter and PDPG D, and minimal lumen diameter and DPPR E. The angiographic severity of stenosis was not indicative of functional impairment.

