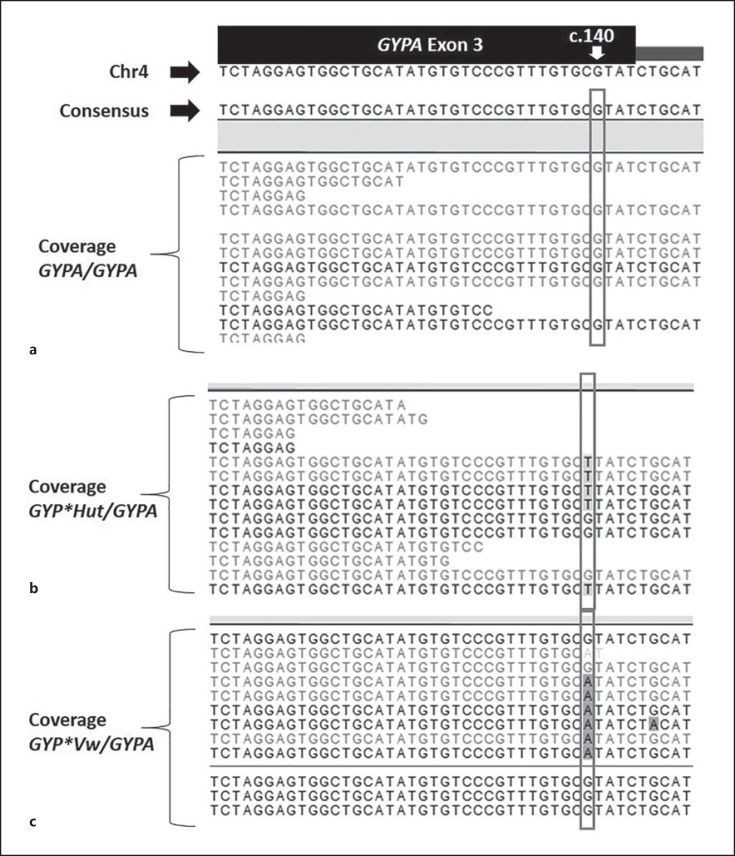
Fig. 3.
Sequence alignment for group 1 samples. a Representative sequences for GYPA/GYPA DNA control aligned to the GYPA exon 3 reference sequences. b Representative sequences for GYP*Hut/GYPA heterozygote – donors 1 and 2. c Representative sequences for GYP*Vw/GYPA heterozygote – donors 3, 6, and 8. Refer to diagram and legend of Figure 1 for GYPA exon 3 sequence. Nucleotide detected at c.140 predicts the base on the complementary strand. Grey box indicates nucleotides in position c.140 for group 1 DNA sequences.

