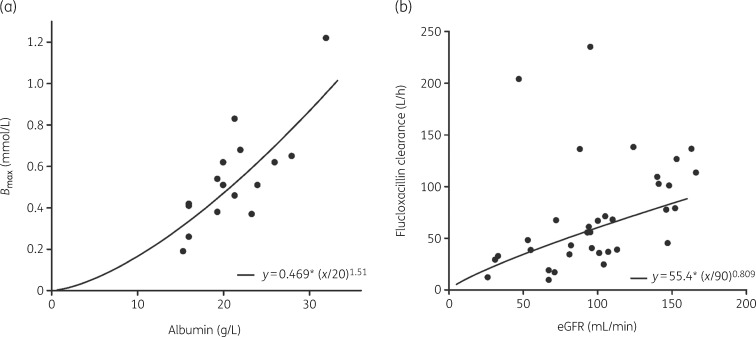
Figure 3.
Covariate relationship between (a) serum albumin concentrations and Bmax and (b) eGFR and CL of unbound flucloxacillin for the final model, for all patients for whom both total and unbound concentrations were measured (n = 16). The dots represent the individual estimates of (a) Bmax and (b) unbound flucloxacillin CL. The line represents the model-predicted association between the parameter estimate and the covariate of interest.

