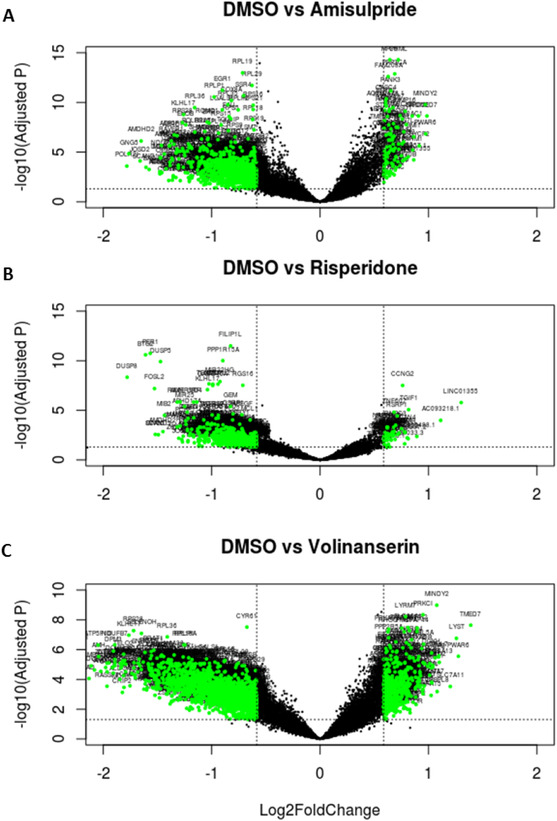
FIGURE 2.

Volcano plots illustrating differentially expressed genes for amisulpride, risperidone, and volinanserin versus dimehtyl sulfoxide (DMSO). Dotted horizontal lines mark adjusted P‐value threshold of .05; dotted vertical lines mark log 1.5‐fold change threshold. Green markers indicate statistically significantly differentially expressed genes with > ±1.5‐fold change
