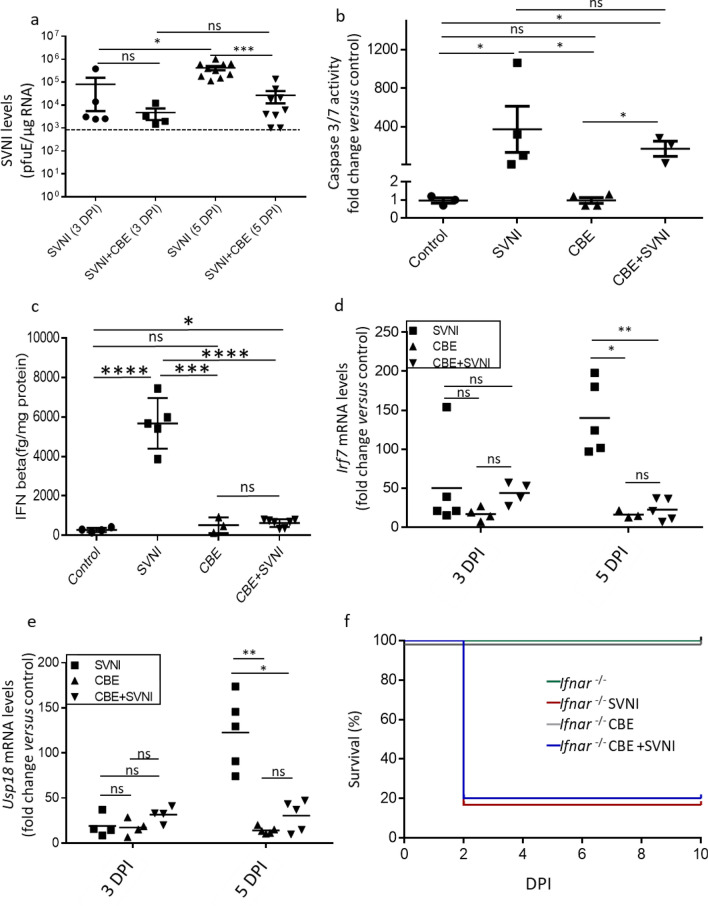
Fig. 2.
Brain pathology in nGD mice upon SVNI infection. Data were obtained from C57BL/6 mice untreated (control) or treated with CBE (50 mg/kg per day) from 13 days of age, uninfected or infected with a lethal dose (30 pfu) of SVNI at 21 days of age. a SVNI viral load in brain homogenates was determined by qPCR at 3 and 5 days post infection (DPI). Levels of viral RNA were calculated based on standard curves and data are presented as plaque forming unit equivalents (pfuE)/μg RNA. Similar levels of viral RNA in the brains of SVNI and CBE + SVNI mice 3 days post SVNI infection. Less viral RNA in CBE + SVNI compared to SVNI mice five-days post SVNI infection. Results are mean ± SEM (n = 5 for SVNI 3 DPI, n = 4 for CBE + SVNI 3 DPI, n = 10 for SVNI 5 DPI, n = 9 for CBE + SVNI 5 DPI). The dotted line reflects the limit of detection. Statistical analysis was performed using a two-tailed unpaired t-test. *p < 0.05, ***p < 0.001, ns, not significant. b Activity of caspase-3/7 in brain homogenates 5-DPI. Activities were normalized to 100% of the values of control mice. Values are mean ± SEM. (n = 3 for control and CBE + SVNI, n = 4 for SVNI and CBE). ns not significant. Statistical analysis was performed using a Kruskal–Wallis test followed by Dunn’s post hoc pairwise comparisons. *p < 0.05. ns not significant. c ELISA analysis of IFNβ protein levels in cortical homogenates from control, SVNI, CBE, and CBE + SVNI mice 5 DPI. Values are mean ± SEM. (n = 4 for control, n = 5 for SVNI, n = 3 for CBE, n = 7 for CBE + SVNI). Statistical analysis was performed using a two-tailed unpaired t-test. *p < 0.05, ****p < 0.0001, ns not significant. d, e qPCR of Irf7 (d) and Usp18 (e) in cortical homogenates from control, SVNI, CBE, and CBE + SVNI mice, 3 and 5 DPI. Results are presented as fold-change versus control and are expressed as mean ± SEM. CT values were normalized to levels of HPRT. Statistical analysis was performed using a Kruskal–Wallis test followed by Dunn’s post hoc pairwise comparisons. ***p < 0.001, ****p < 0.0001, ns not significant. n = 3–5 for each group. f Survival rate of Ifnar–/– mice untreated and treated with CBE (50 mg/kg per day) from 13 days of age, uninfected and infected with a lethal dose (5 pfu) of SVNI at 21 days of age. (n = 5–6 mice/group). Log-rank test for comparisons of Kaplan–Meier survival curves indicated no significant difference in the mortality of Ifnar–/– +SVNI + CBE compared to Ifnar–/– +SVNI mice

