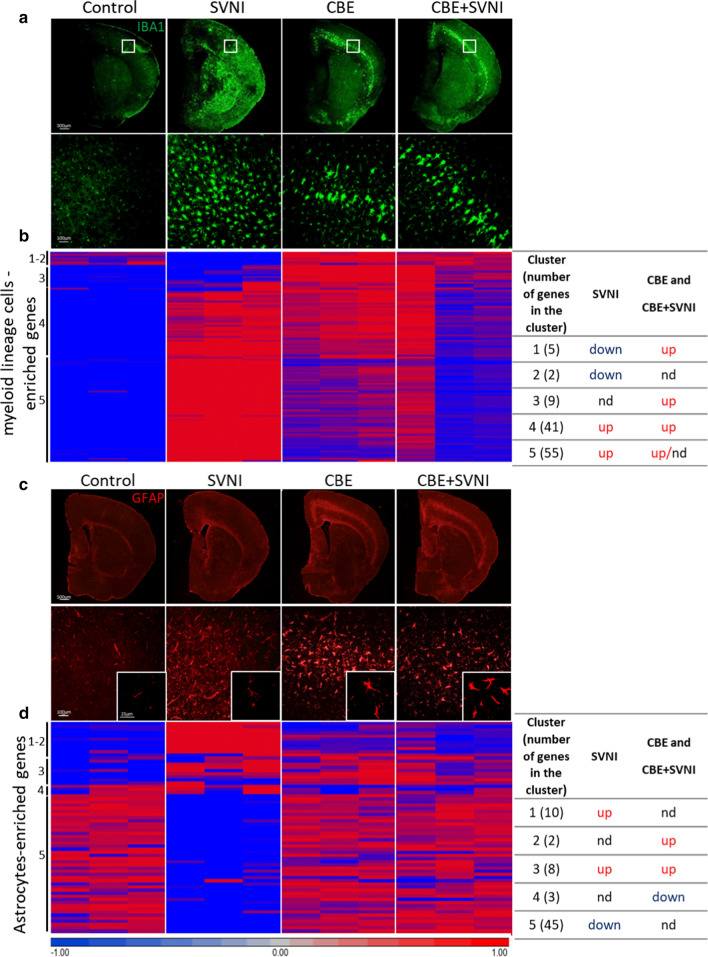
Fig. 4.
Activation of myeloid lineage cells with abrogated activation of astrocytes upon infection with SVNI. Data were obtained from C57BL/6 mice untreated (control) or treated with CBE (50 mg/kg per day) from 13 days of age, uninfected or infected with a lethal dose (30 pfu) of SVNI on 21 days of age. Data were obtained 5–6 DPI. a Immunofluorescence using an anti-IBA1 (green) antibody (×2 magnification; upper panel, ×20 magnification; lower panel). IBA1 staining of ×2 magnification was evaluated using ImageJ. Control, SVNI, CBE, and CBE + SVNI contain ~ 382 ± 122, 1801 ± 144, 987 ± 177, and 1157 ± 182 IBA1-positive cells, respectively. Results are representative of three biological replicates. b Heat maps of RNAseq comparing brains of control, SVNI, CBE, and CBE + SVNI mice, represented by lists of 112 genes enriched in myeloid lineage cells showing enrichment and de-enrichment of mRNAs in different samples. A summary of the clusters is presented in the table (right). Datasets in Datasets in Additional file 5: Table S4. Each column represents an individual mouse, n = 3 for each group. nd no difference. c Immunofluorescence using an anti-GFAP (red) antibody (×2 magnification; upper panel, ×20 magnification; lower panel). GFAP staining of ×2 magnification was evaluated using ImageJ. Control, SVNI, CBE, and CBE + SVNI contain ~ 666 ± 48, 823 ± 167, 990 ± 185, and 1131 ± 44 GFAP-positive cells, respectively. Results are representative of three biological replicates. d Heat maps of RNAseq from brains of control, SVNI, CBE, and CBE + SVNI mice, represented by lists of 68 genes enriched in astrocytes showing enrichment and de-enrichment of mRNAs in the different samples. A summary of the clusters is presented in the table (right). Datasets in Additional file 5: Table S4. Each column represents an individual mouse, n = 3 for each group

