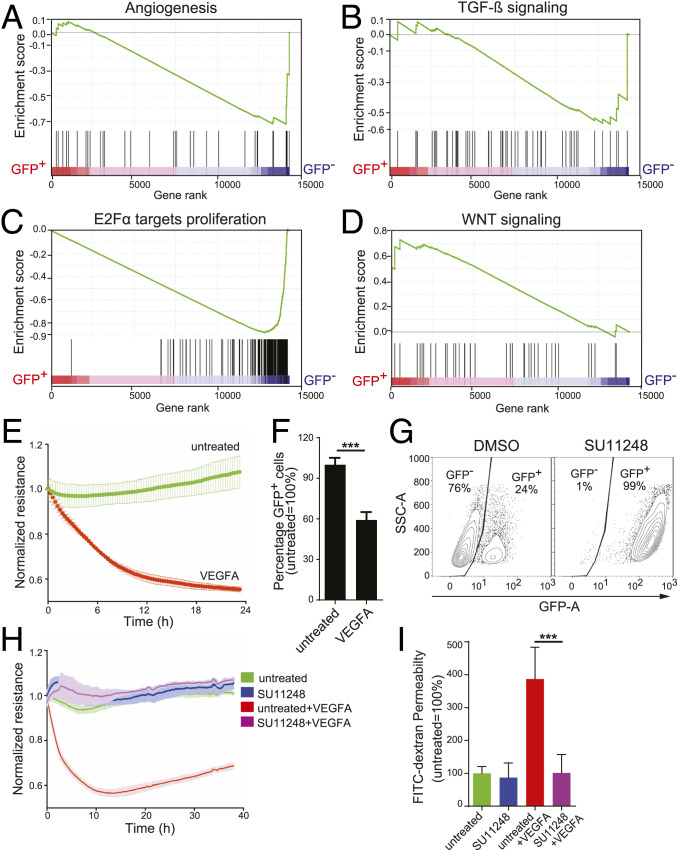
Fig. 2.
The GFP+ population of CLDN5-GFP reporter ECs has both the gene expression signature and functional response of endothelial cell barriers. (A–D) Gene set enrichment analysis (GSEA) enrichment plots of CLDN5-GFP+ or CLDN5-GFP− populations of CLDN5-GFP hPSC-ECs for pathways relevant to barrier functions: (A) angiogenesis, (B) TGF-β, (C) E2Fα proliferation, and (D) Wnt signaling. The enrichment scores (ESs) are plotted at the top of each panel, and a value of the ranking metric throughout the list of ranked genes is depicted at the bottom of each panel (from left to right). Genes were ranked by the product of log2-FC and negative log of FDR value. (E) The CLDN5-GFP+ hPSC-EC population was stimulated with 50 ng/mL VEGFA, and ECIS was measured in real time. (F) After 48 h of VEGFA treatment, the relative percent of CLDN5-GFP+ hPSC-ECs was measured using FACS. (G–I) CLDN5-GFP hPSC-ECs were treated with the tyrosine kinase inhibitor SU11248 (at 5 μM for 48 h) or with a DMSO control and analyzed as follows: (G) The percentage of CLDN5-GFP+ hPSC-ECs was quantified using FACS, y axis represents side-scatter area; (H) impedance was measured in real time; and (I) FITC-dextran permeability was measured. Columns are means ± SD. The permeability assays and impedance measurements were performed as three independent experiments with at least three replicates. ***P < 0.001.

