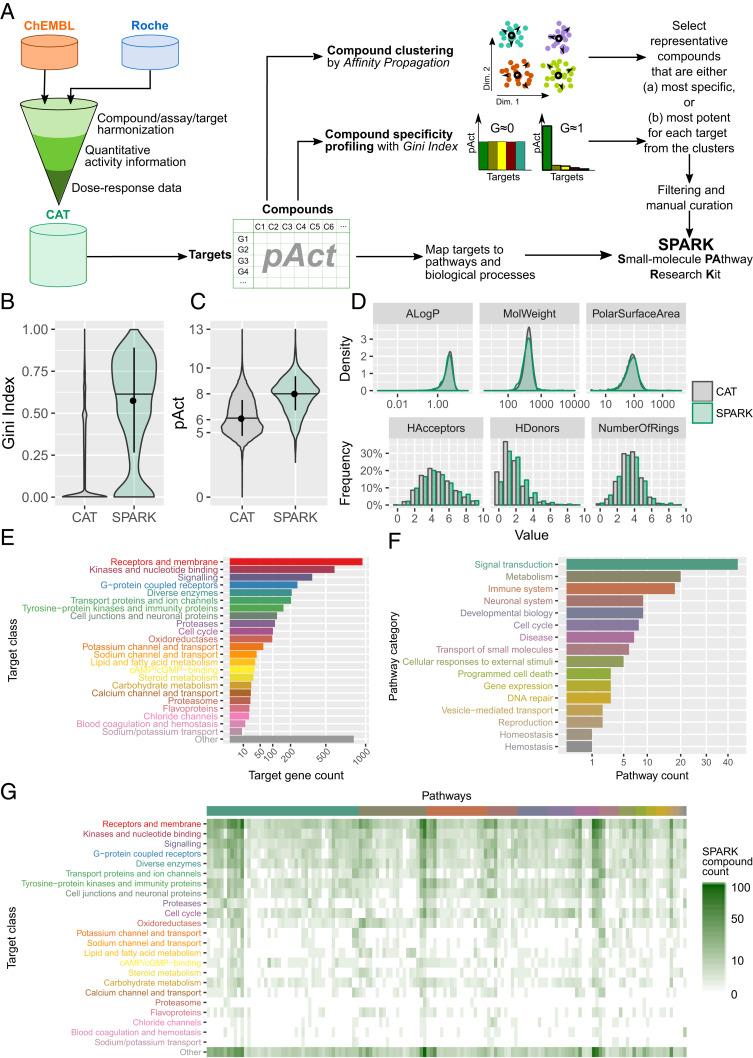
Fig. 3.
Design and characterization of SPARK, a chemogenomic library. (A) A schematic of the workflow used to establish the CAT database and construct the SPARK library. (B–D) A comparison of the compounds in the CAT database and in the SPARK library in terms of (B) Gini Index values, (C) pAct values against primary targets, and (D) profiles of molecular descriptors, which include: ALogP, an estimate of the molecular hydrophobicity (lipophilicity) defined as the logarithm of the 1-octanol/water partition coefficient; MolWeight, molecular weight (in daltons); PolarSurfaceArea, defined as the surface sum over all polar atoms; HAcceptors, proton acceptors; HDonors, proton donors; NumberOfRings, number of aromatic rings. (E) Protein classes targeted by compounds in the SPARK library (filtered by median of pAct ≥ 6) as defined by UniProt keywords. Bars show the count of unique target genes in each class. (F) Biological pathway categories associated with target genes of SPARK compounds, defined by a combination of Reactome pathways, KEGG pathways, and GO BP terms, and consolidated by a heuristic fuzzy partition algorithm. Bars show the count of unique pathways in each category. (G) A heat map of SPARK compounds that target proteins of a given class (in rows) and within a given biological pathways (in columns). Target classes follow the same order as in E. Pathways are organized by categories in the same order as in F. Within each category, pathways are ordered by hierarchical clustering.

