Fig. 5.
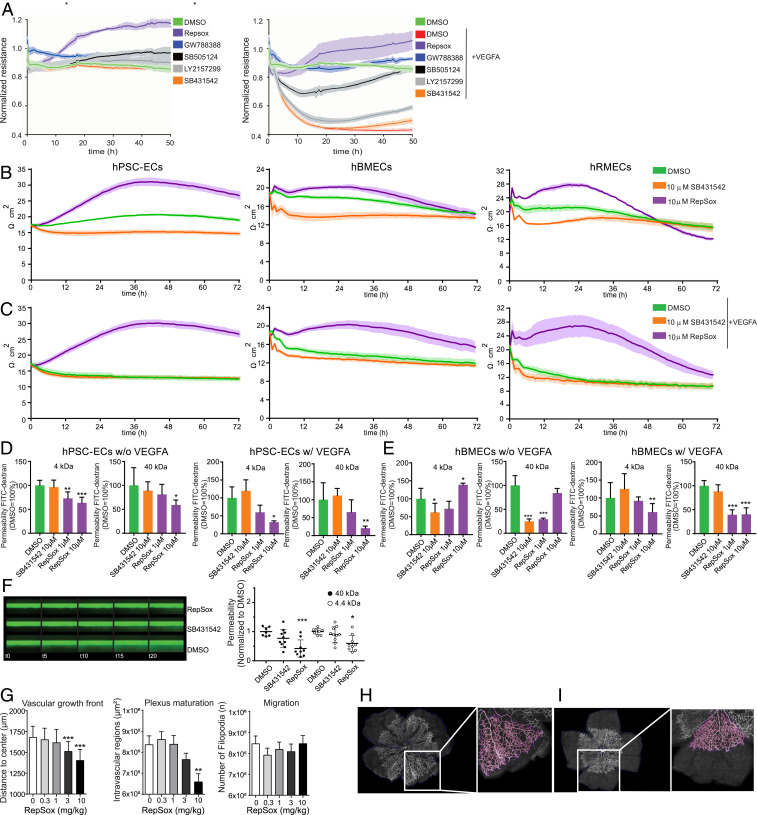
Functional barrier evaluation after treatment with RepSox and SB431542. (A) CLDN5-GFP hPSC-ECs were analyzed by ECIS in the presence and absence of five different TGF-β pathway inhibitors without (Left Graph) or with (Right Graph) the addition of VEGFA. Compounds are shown based on capability to induce barrier, top to bottom. (B) The absolute TEER values (Ω∙cm2) after treatment with DMSO or 10 µM SB431542 or 10 µM RepSox on (Left) hPSC-ECs, (Middle) hBMECs, and (Right) hRMECs. (C) The absolute TEER (Ω∙cm2) values with cotreatment of VEGFA and compounds, DMSO, 10 µM SB431542, or 10 µM RepSox on (Left) hPSC-ECs, (Middle) hBMECs, and (Right) hRMECs. All TEER assays were performed as at least three independent experiments with three replicates for each condition. (D and E) The FITC-dextran (4 and 40 kDa) permeability assay. (D, Left) hPSC-ECs treated with DMSO, 10 µM SB431542, or 10 µM RepSox and (D, Right) cotreated with VEGFA and DMSO, 10 µM SB431542, or 1 and 10 µM RepSox. (E, Left) hBMECs treated with DMSO, 10 µM SB431542, or 1 and 10 µM RepSox and (E, Right) cotreated with VEGFA and DMSO, 10 µM SB431542, or 1 and 10 µM RepSox. (F) The barrier on-a-chip assay with hRMECs. (Left) Barrier integrity assay in hRMEC: 40-kDa FITC-dextran solution is perfused in the endothelial tube, and leakage in the adjacent channel is monitored over the course of 20 min. (Right) apparent permeability of hRMEC to 40 kDa and 4.4 kDa dextran. Results represent means ± SD and were normalized to DMSO control. (G) Segmentation and quantification of vascular sprouting in a flat mounted newborn mouse retina after treatment with RepSox in a dose–response. (Left) The radial expansion of the vascular front was measured as distance from the center to the peripheral retinal. (Middle) Plexus maturation was calculated as the mean area of intravascular lesions representing the primitive plexus area. (Right) Migration was estimated based on the number of filopodia. (H and I) Representative images of segmented retinal flat mounts (pink) computationally traced vessels in the retina: (H) control treated and (I) treated with 3 mg/kg RepSox, respectively with magnification at 20×. Columns are means ± SD. *P < 0.05, **P < 0.01, ***P < 0.001.

