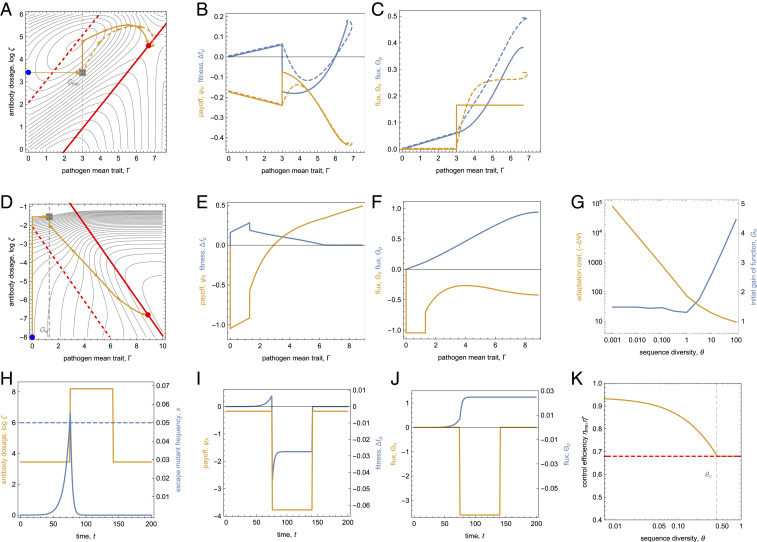
Fig. 4.
Control dynamics. (A–C) Ecological control by instantaneous-update protocols. (A) Control paths generated by local deterministic (dashed orange) and greedy (solid orange) control dynamics. These paths start with a pathogen escape mutation (gray square) and converge to the optimal stationary protocol (red dot), which is a computational and a Nash equilibrium. (B) Time-dependent pathogen fitness, , and host payoff, , of these control paths. (C) Pathogen flux, , and host flux, . Both fluxes are monotonically increasing functions of the path coordinate . (D–G) Evolutionary control for adaptive trait formation. (D) Deterministic computational control path in the SC regime (orange line). This path maximizes the score for given values of the speed parameter and of the pathogen sequence diversity (here , ) (SI Appendix, Fig. S3). The initiation phase () with a gain-of-function mutation (gray square) is followed by a breeding phase (); the path converges to the optimal stationary protocol (red dot), which is a computational but not a Nash equilibrium. (E) Pathogen fitness, , and host payoff, , along the computational control path. (F) Fluxes and as functions of the path coordinate . This path has negative increments of the host flux () at the start and in the final segment. (G) Cost of adaptation, (orange), and initial gain-of-function trait, (blue), of the maximum-score computational protocol as a function of the pathogen diversity, for . (H–K) Metastable ecological control. (H) Time-dependent protocol with baseline dosage , boost dosage , and boost duration (orange); pathogen escape mutant frequency (blue) using a detection threshold to initiate rescue boost (dashed line). (I) Pathogen mean fitness, , and host payoff, . (J) Fluxes, and . (K) Efficiency of maximum-score metastable protocols, (orange), as a function of the pathogen diversity, , together with the efficiency of the optimal stationary protocol, (red dashed). For , metastable control outperforms stationary control. Parameters: , others as in Fig. 2.

