Fig. 2.
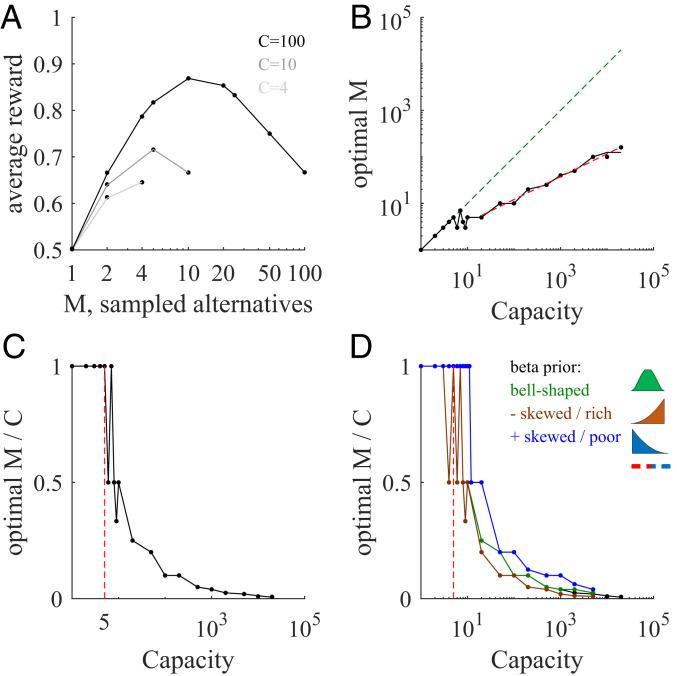
Sharp transitions in optimal number of sampled alternatives at low capacity, and power law behavior at large capacity. (A) Average reward (points, simulations; lines, theoretical expressions; Eq. 4) as a function of the number of sampled alternatives for three different capacities (; light, intermediate, and dark lines, respectively) for the flat environment (uniform prior). The maximum occurs at the large extreme for low capacity but at a relatively low value for large capacity. Note log horizontal scale. (B) Optimal number of sampled alternatives as a function of capacity. When capacity is smaller than around 5, a linear trend of unit slope is observed (dashed green line), but when capacity is above 7, a sublinear behavior is observed (dashed red line corresponds to the best power law fit, with exponent close to 1/2). The black line corresponds to analytical predictions. The jagged nature of this prediction and simulation lines in this and other panels is due to the discrete values that the optimal can only take, not due to numerical undersampling. (C) The sharp transition is clearer when plotting the optimal number of sampled alternatives to capacity ratio as a function of capacity. For low capacity, the ratio is 1, but for large capacity the ratio decreases very rapidly. The last point below which the optimal ratio is always 1 (critical capacity) corresponds to capacity equal to 5 (indicated with a vertical red line). (D) Number of sampled alternatives to capacity ratios for different prior distributions ( bell-shaped, green line; , negatively skewed prior modeling a “rich” environment, brown line; , positively skewed distribution modeling looking for a “needle in a haystack,” that is, a “poor” environment, blue line). Lines correspond to analytical predictions from SI Appendix, Eq. 9; points correspond to numerical simulations; error bars are smaller than data points in all panels.

