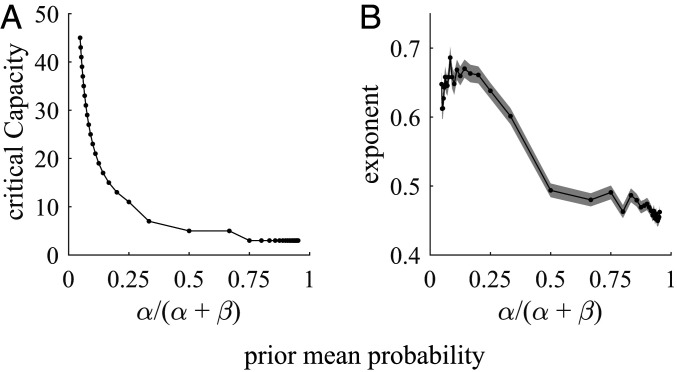
Fig. 3.
Sharp transitions at relatively low-capacity values and close to square root sampling behavior for large capacity are observed for a broad range of parameters of the prior distribution. (A) Critical capacity decreases very steeply to low values (∼10) as a function of the prior mean probability . (B) Exponents decrease as a function of the prior mean probability and cluster around 1/2. The exponents are obtained from log-log linear regression fits of the optimal number of alternatives samples vs. capacity for values ranging from 1,000 to 2,000 in steps of 1. Shaded areas correspond to 95% CIs. In both panels, points are obtained by theoretical predictions from SI Appendix, Eq. 9. For prior mean probabilities smaller than or equal to 1/2, we fix while varies from 1 to 20 in steps of 1, and for values larger than 1/2, we fix while varies from 1 to 20.

