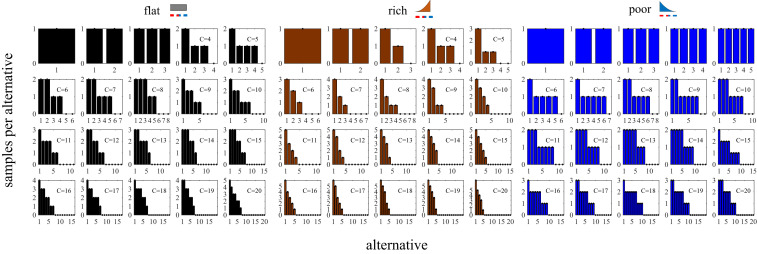
Fig. 4.
Optimal sample allocations and choice sets. Optimal sample allocation for flat, rich, and poor environments from capacity up to . The environments correspond, respectively, to uniform, negatively and positively skewed prior distributions (top icons). Optimal sample allocations are represented as bar plots, indicating the number of samples allocated to each alternative ordered from the most to the least sampled alternative.

