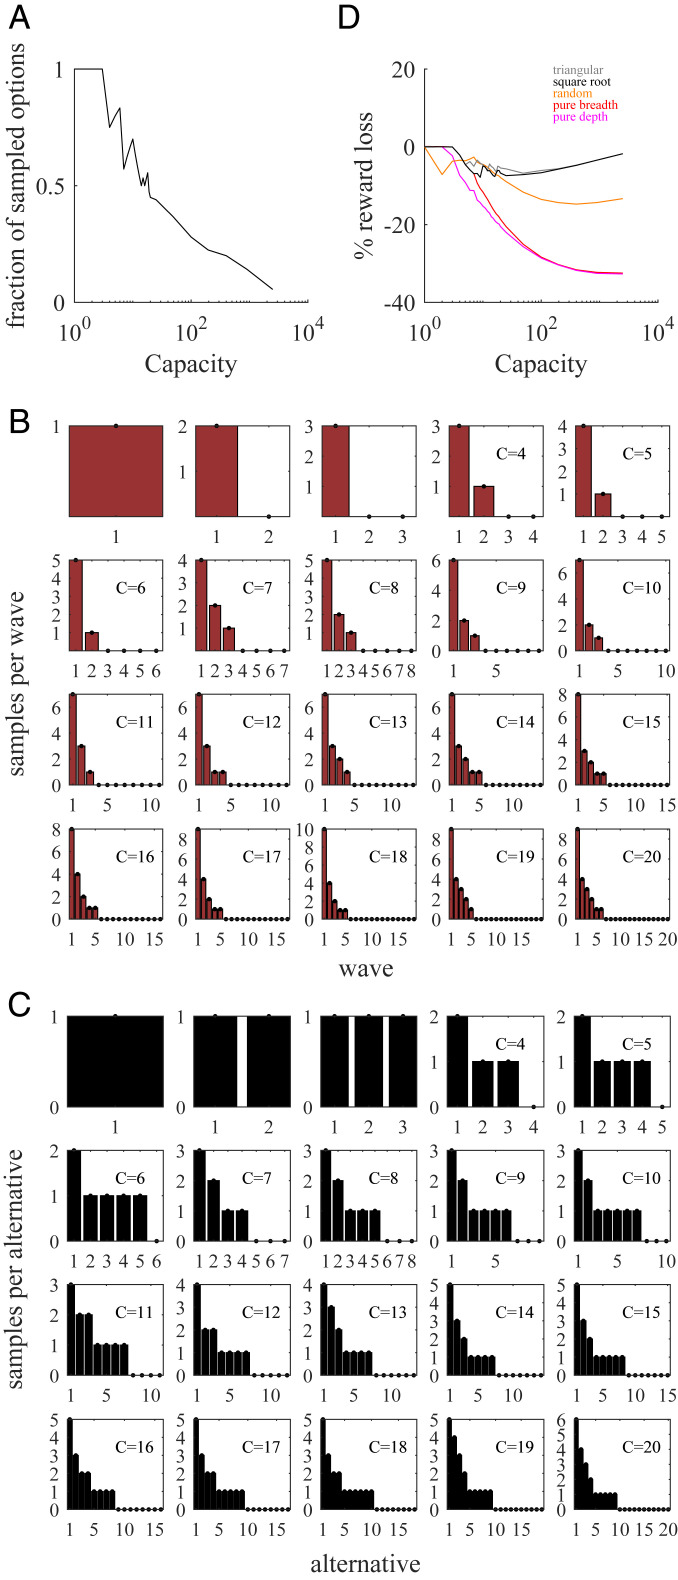
Fig. 6.
Optimal dynamic sample allocations display a sharp transition at low capacity, distribute samples unevenly across alternatives, and ignore a vast number of alternatives at high capacity. (A) Fraction of sampled alternatives (compared to the maximum number of potentially accessible alternatives, equal to ) as a function of capacity for the flat environment (uniform prior). The fraction is 1 for small-capacity values and decays rapidly to zero at large capacity. (B) Optimal sample waves, indicating the number of samples allocated in each wave. The number of samples allocated in each wave lies between 1 and , and they sum up to the total available capacity . The maximum allowed number of waves is . (C) Optimal dynamic sample allocations and choice sets after the whole capacity has been allocated through the sample waves. The alternatives with largest number of successes are allocated a higher number of samples compared to static allocations (cf. Fig. 4). Many alternatives are given just one sample, typically arising from the first wave, which produces broader sample allocations compared to static allocations. (D) Percentage loss in averaged reward by using triangular (gray), square root sampling law (black), random (orange), pure breadth (red), and pure depth (pink) static heuristics compared to optimal dynamic allocation.

