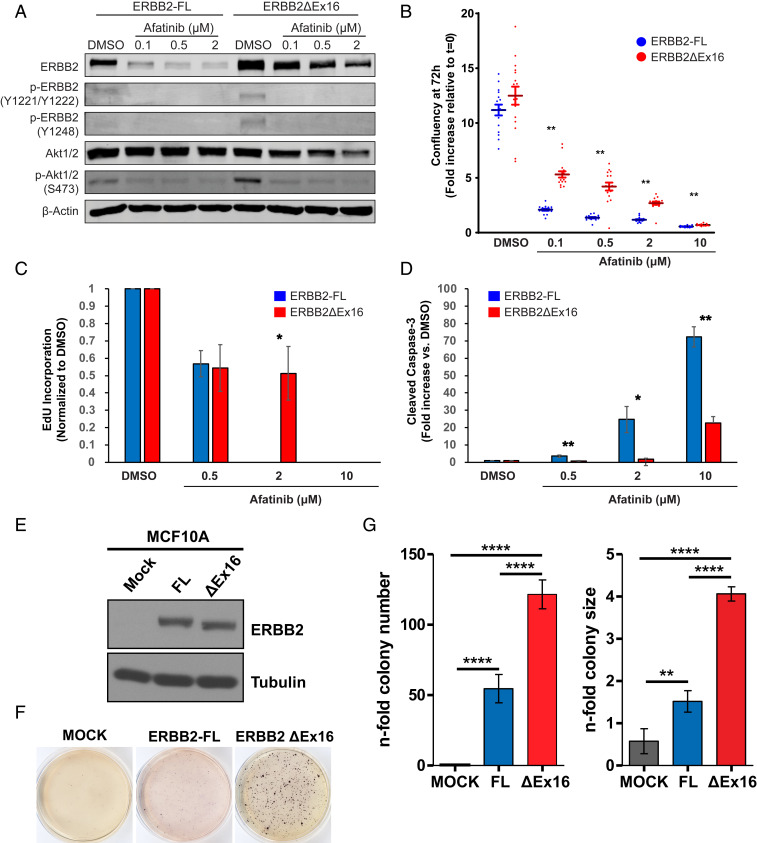
Fig. 4.
ErbB2ΔEx16 transforms immortalized epithelial cells and confers resistance to ErbB2 kinase inhibition compared to ERBB2-FL. (A) RLE-6TN cells stably expressing ERBB2 isoforms were treated with Afatinib at the indicated concentrations or DMSO (vehicle). After 24 h, cell lysates were immunoblotted with the indicated antibodies. (B) RLE-6TN stable cell lines as in A were treated with the indicated concentrations of Afatinib or with DMSO, and their proliferation was monitored by image-based analysis of cell confluency. Data shown are mean fold increase in confluency at 72 h posttreatment relative to the beginning of the assay (t = 0), +/− SEM, and are representative of two independent experiments, each with six replicates per condition. **P < 0.01, unpaired Student’s t test of RLE-6TN/ERBB2-FL vs. RLE-6TN/ERBB2ΔEx16 for each condition. For both cell lines, proliferation at each concentration of Afatinib was significantly (P < 0.01) lower than the DMSO control. (C and D) RLE-6TN stable cell lines were treated with the indicated concentrations of Afatinib or DMSO for 24 h, and immunofluorescence was used to quantify cell cycle progression (C, EdU incorporation) and apoptosis (D, cleaved Caspase-3 immunostaining) with normalization to the DMSO control. Data are the mean +/− SEM of six replicates. *P < 0.05, **P < 0.01, unpaired Student’s t test of RLE-6TN/ERBB2-FL vs. RLE-6TN/ERBB2ΔEx16 for each condition. (E) Cell lysates from MCF10-A cells stably expressing ERBB2 isoforms were immunoblotted with the indicated antibodies. (F and G) Anchorage-independent growth potential was assessed by soft agar assay of MCF10A cells expressing ERBB2 isoforms. Cells were stained with MTT and photographed after 2 wk (F), and colony number and size were quantified (G). Data are represented as mean ± SD. **P < 0.01, ****P < 0.0001, unpaired Student’s t test.

