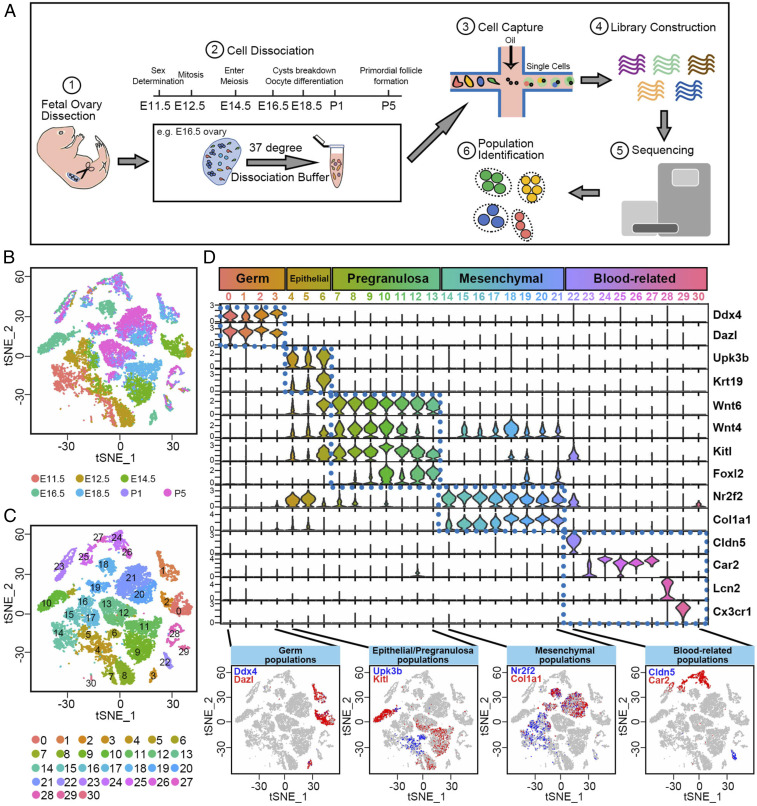
Fig. 1.
Single-cell transcriptome landscape of fetal ovarian development. (A) Schematic experimental workflow using the 10X Genomics Chromium platform followed by clustering using Seurat (43). (B) A 2D visualization of single-cell clusters using tSNE colored by developmental time from E11.5 to P5. (C) A 2D visualization of single-cell clusters using tSNE colored by 31 identified cell types/clusters (numbers). (D) Summary of marker gene expression in cell clusters: Clusters 0 to 30 were subdivided into five subclasses based on gene expression (dotted boxes). (Bottom) Violin plots show marker gene expression in each cluster. y axis scale: a normalized UMI-per-cell scale for each gene to facilitate display. The Bottom of D shows the expression of marker genes (red and blue) from each subclass.

