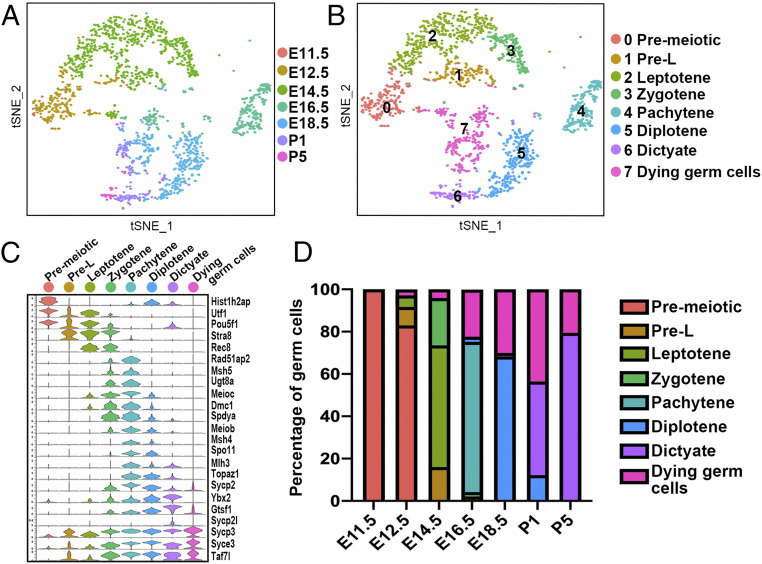
Fig. 2.
Dynamic gene expression patterns of mouse female germ cells. (A) Two-dimensional (2D) visualization of clusters from all germ cells using tSNE. Cells are colored by developmental stage from E11.5 to P5. (B) Two-dimensional visualization of integrated germ cell clusters using tSNE. Cells are colored by eight inferred developmental stages (see key for stage names). (C) Multiviolin plot of selected meiosis-related gene expression during the eight developmental stages. y axis scale: same as Fig. 1D. (D) Cell distribution among the eight stages at each time point.

