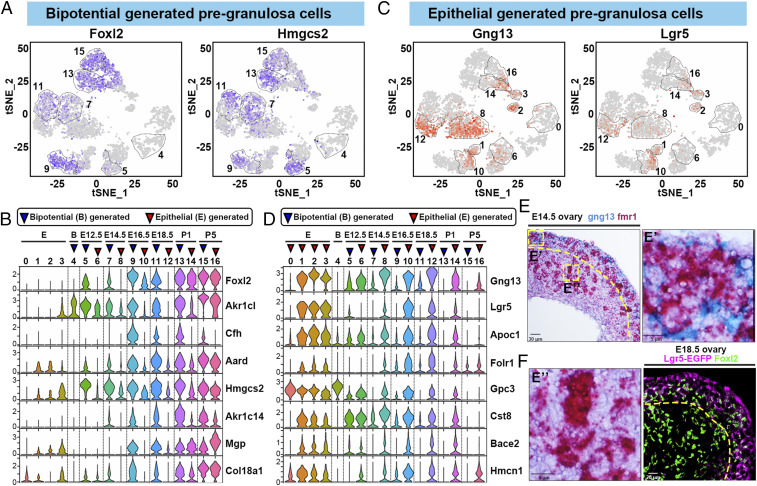
Fig. 4.
Distinct gene expression patterns of BPG and EPG cells. (A) Expression of Foxl2 and Hmgcs2 in epithelial and PG cell clusters; color intensity indicates level of expression. The thin dashed lines indicate bipotential and BPG clusters. (B) A multiviolin plot showing the relative expression of BPG marker genes (gene names at right) in cell clusters (numbers at top). Blue triangle: BP or BPG cluster; red triangle: EPG cluster. Epithelial clusters (E) and developmental times are also indicated. (C) Expression of Gng13 and Lgr5 in epithelial and PG cell clusters; color intensity indicates level of expression. The thin dashed lines indicate epithelial and EPG clusters. (D) A multiviolin plot showing the relative expression of EPG marker genes (gene names at right). The blue and red triangles indicate bipotential (B), epithelial (E), BPG, and EPG clusters. Developmental times are also indicated. (E) ISH of Gng13 (blue) and Fmr1 (red) mRNA in the E14.5 ovary. Gng13-expressing PG cells are observed in a cortical region (E′) but are absent from a medullar region (E″). (F) Cellular localization of Lgr5-GFP and Foxl2 in E18.5 ovaries by immunofluorescence. Curved dashed lines in E and F show the boundary of the cortical and medullar regions.

