Fig. 3.
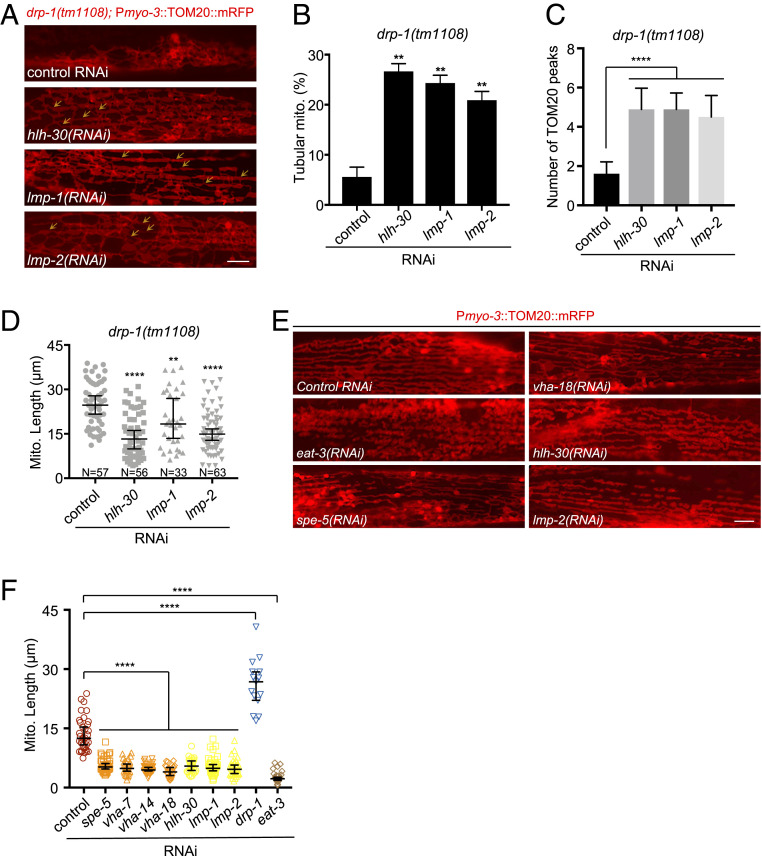
Lysosomal activity affects mitochondrial dynamics. (A) Mitochondrial morphology in drp-1(tm1108) body wall muscles after indicated RNAi treatment. Arrows indicate some examples of nice parallel mitochondrial structure. (Scale bar, 5 μm.) (B) Percentage of mitochondria with tubular morphology in drp-1(tm1108) body wall muscles after indicated RNAi treatments. Mean ± SD **P < 0.01. (C) Peak numbers for the plot profiles of mitochondrial morphology in indicated animals. Mean ± SD ****P < 0.0001. n = 40∼50 for each group. (D) Mitochondrial lengths in body wall muscles in indicated animals. Mitochondrial lengths were calculated by MiNA toolset. Median with 95% CI Mann–Whitney U test. ****P < 0.0001, **P < 0.01. N indicates the sample size. (E) Mitochondrial morphology in body wall muscles after indicated RNAi treatment. (Scale bar, 5 μm.) (F) Lengths of mitochondria after indicated gene inactivations by RNAi in N2 (wild-type). n = 15∼40, Median with 95% CI Mann–Whitney U test. ****P < 0.0001.

