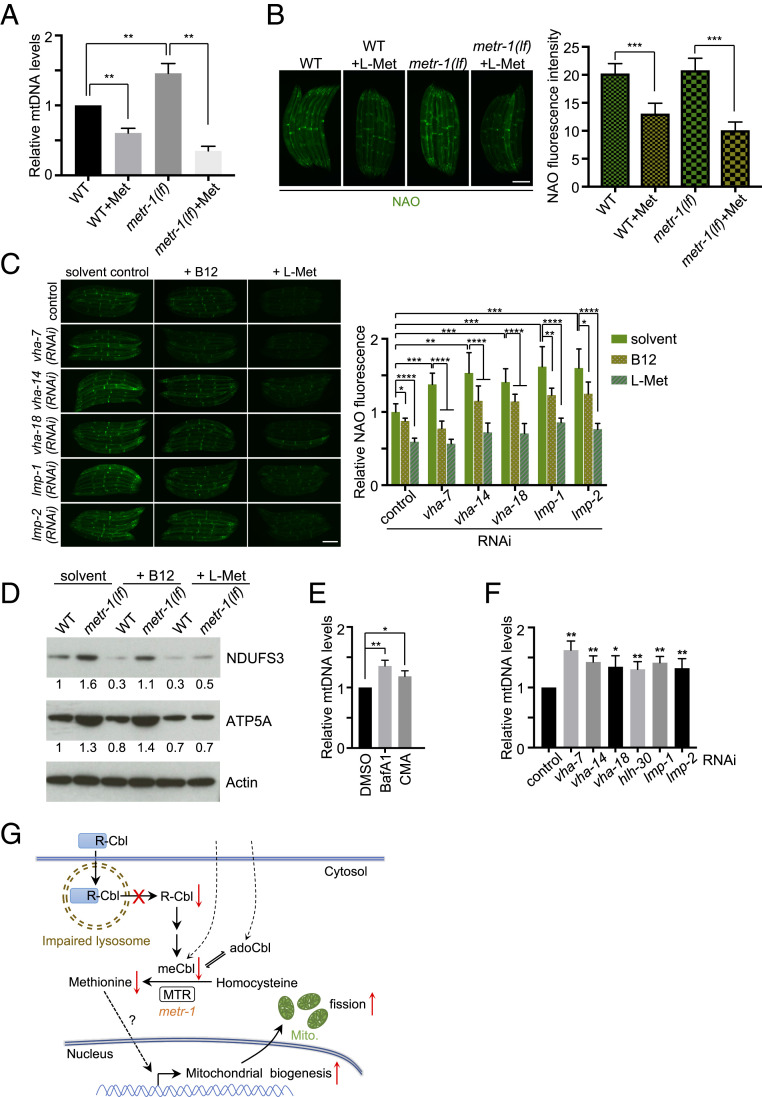
Fig. 6.
Lysosomal dysfunction leads to increase mitochondrial mass. (A) Relative mitochondrial DNA levels in wild-type and metr-1(lf) animals with or without methionine supplementation. Mean ± SD from at least three biological replicates. **P < 0.01. (B and C) Animals with indicated treatment were stained with NAO. Mean ± SD ****P < 0.0001, ***P < 0.001, **P < 0.01, *P < 0.05. (Scale bars, 0.2 mm.) (D) Immunoblots of lysates from animals with indicated treatment. Relative protein levels are indicated below the gel lanes. (E and F) Relative mitochondrial DNA levels in animals with indicated treatment. Mean ± SD from at least three biological replicates. **P < 0.01, *P < 0.05. (G) A model for lysosomal activity affects mitochondrial fission through vitamin B12 metabolism.

