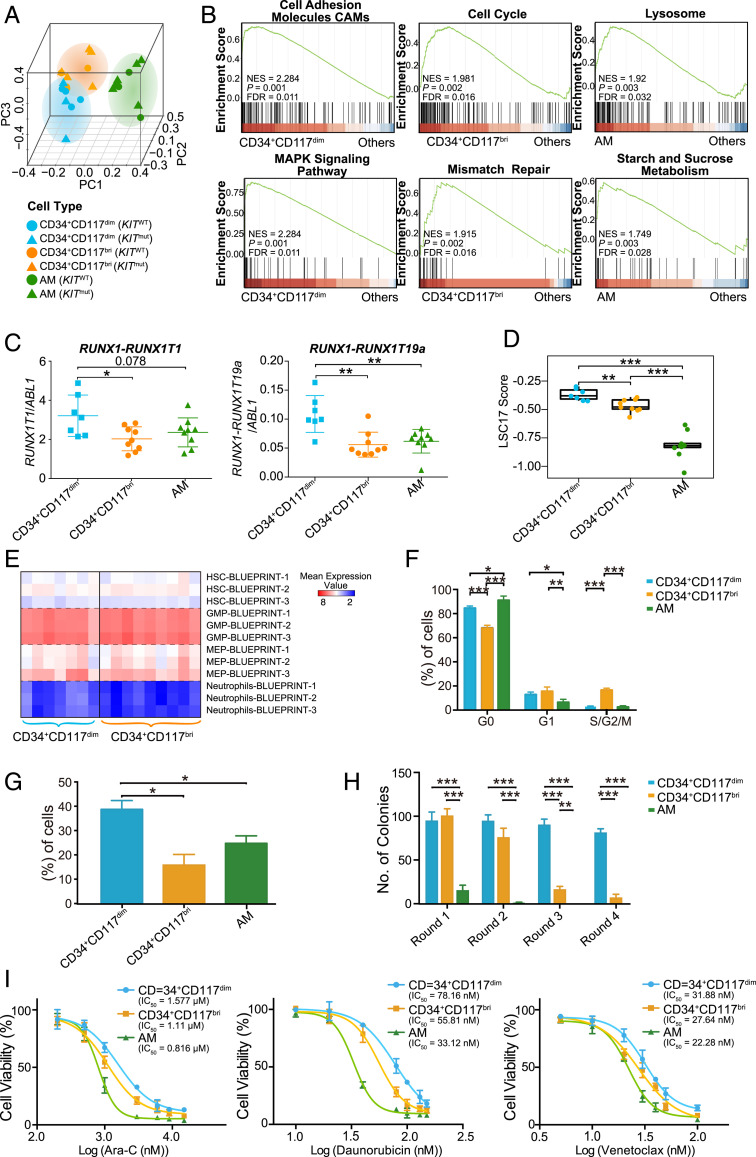
Fig. 2.
Gene expression profiles and biological characteristics of CD34+CD117dim, CD34+CD117bri, and AM cell populations. (A) PCA plot of isolated CD34+CD117dim, CD34+CD117bri, and AM populations. Triangles and circles represent cells with KIT mutation (KITmut) and KIT wild-type (KITWT) status, respectively. (B) Representative GSEA plots showing the activated pathways in CD34+CD117dim, CD34+CD117bri, and AM cell populations. Normalized enrichment score (NES) values, nominal P values, and false discovery rate (FDR) values are given. (C) Relative expression levels of RUNX1-RUNX1T1 and RUNX1-RUNX1T19a transcripts in isolated CD34+CD117dim, CD34+CD117bri, and AM cell populations based on the RNA-seq data after normalization to the ABL1 read counts (internal reference). (D) LSC17 score of the CD34+CD117dim, CD34+CD117bri, and AM populations. Statistical significance was determined using a two-sided Wilcoxon test. (E) Comparison of the overexpressed gene sets of CD34+CD117dim and CD34+CD117bri myeloblasts with the Blueprint project gene sets. (F) Cell cycle analysis of the isolated CD34+CD117dim, CD34+CD117bri, and AM cell populations. Cell frequencies in G0, G1, and S/G2/M are shown (mean ± SD; n = 3 with duplicates). (G) Transwell migration of isolated CD34+CD117dim, CD34+CD117bri, and AM populations (mean ± SD; n = 3 with duplicates). (H) Colony-forming unit (CFU) assay of isolated CD34+CD117dim, CD34+CD117bri, and AM populations (mean ± SD; n = 3 with duplicates). (I) Cell viability of isolated CD34+CD117dim, CD34+CD117bri, and AM populations on exposure to cytarabine, daunorubicin, and venetoclax (n = 3 with triplicate). *P < 0.05; **P < 0.01; ***P < 0.001, two-sided Student’s t test.

