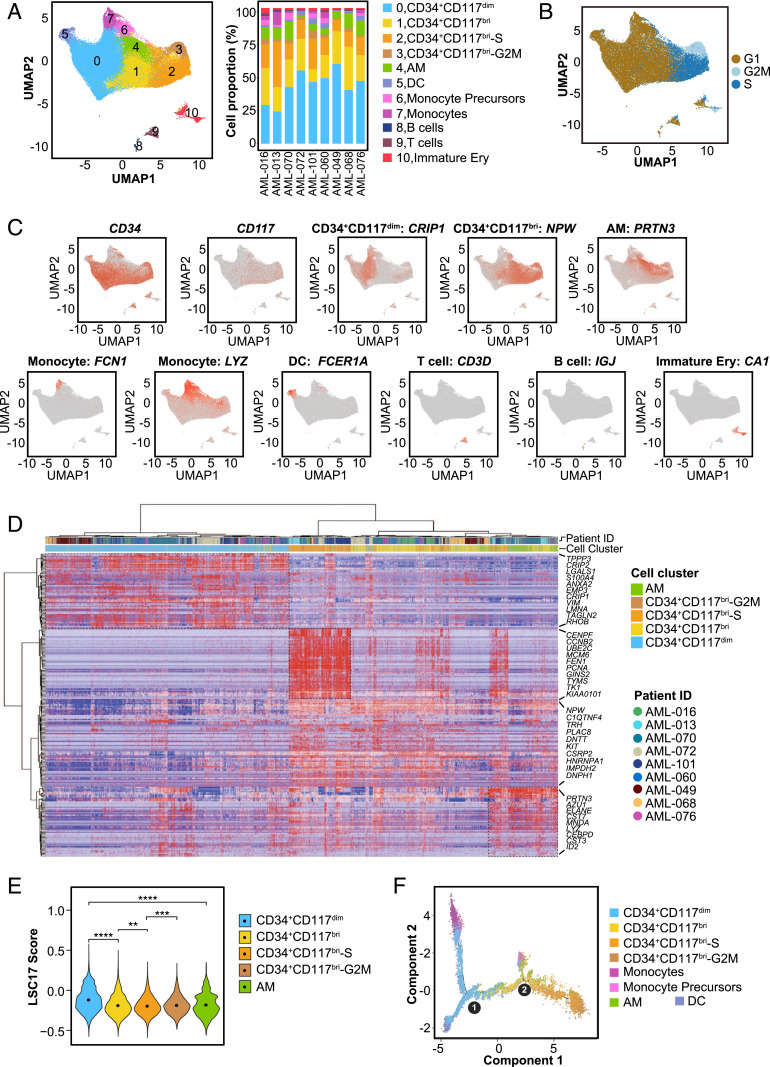
Fig. 3.
Single-cell transcriptomic analysis of t(8;21) AML at diagnosis. (A) UMAP analysis of BMMCs from nine primary t(8;21) AML patients after removing batch effects. Each dot represents a cell, and the colors represent different cell clusters. The right stacked column chart shows the percentage of each cell cluster in each patient. DC, dendritic cells; Immature Ery, immature erythroid cells. (B) UMAP plot of cell cycle state of cells in each cell cluster according to the expression level of cell cycle-specific gene sets. (C) UMAP plots displaying the expression patterns of CD34, CD117, and the representative markers for CD34+CD117dim, CD34+CD117bri, AM, monocytes, DCs, T cells, B cells, and immature erythroid cells. (D) Heatmap of the highly expressed genes in CD34+CD117dim, CD34+CD117bri, CD34+CD117bri-S, CD34+CD117bri-G2M, and AM cell populations from nine t(8;21) AML patients. The relative expression level of genes (rows) across cells (columns) is shown. (E) Violin plot showing the LSC17 score of CD34+CD117dim, CD34+CD117bri, CD34+CD117bri-S, CD34+CD117bri-G2M, and AM clusters. **P < 0.01; ***P < 0.001; ****P < 0.0001, two-sided Wilcoxon test. (F) Trajectory analysis using Monocle 2, with each dot representing an individual cell and colors representing different cell types. Circle 1 represents the beginning (the root), and circle 2 represents the branch point of the trajectory.

