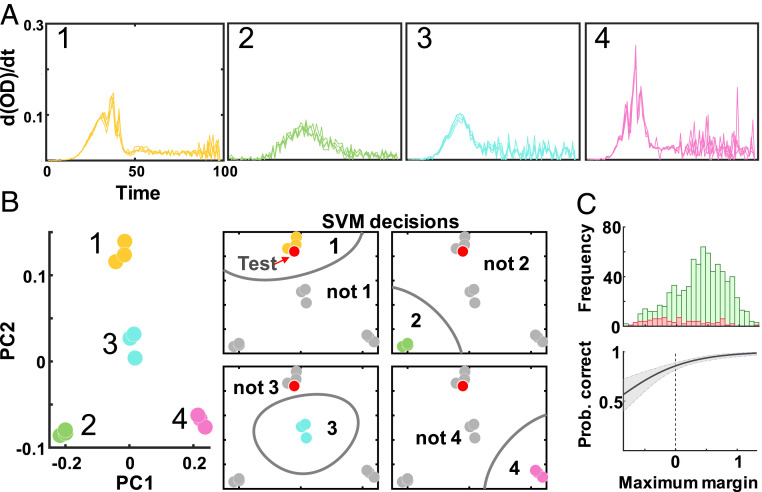
Fig. 3.
Development of prediction confidence. (A) Four-strain example. Growth dynamics are the time derivative of smoothed growth curves (10,000× condition). (B) SVM output. We examine SVM predictions in 2D through principal component analysis as an example for visualization purposes. The Left illustrates the training set. In this four-class example (1, 2, 3, 4), the test point (red) is predicted as 1. (C) Maximum margin: CI estimate. We examine the distribution of maximum margins for correctly classified (green) and misclassified (red) samples in the test set (10,000×). Logistic regression predicts the probability of the prediction being correct; the shaded region indicates the 95% CI.

