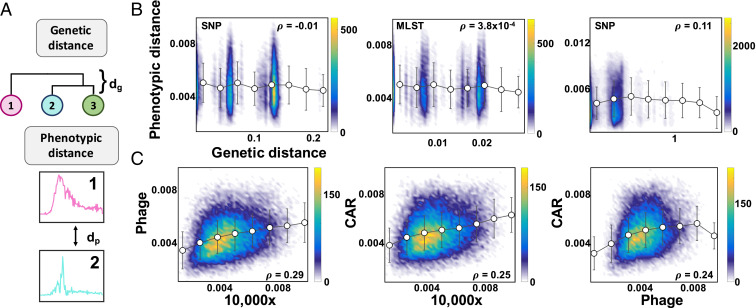
Fig. 4.
Correlation between genetic and phenotypic landscape. (A) Distance metrics. Genetic distance is defined by phylogeny, and phenotypic distance is the Euclidean distance between pairs of curves representing the time derivative of the growth curve. (B) Correlation between genetic and phenotypic distances. Each point in the density plot is defined as the distance comparison (x axis is genetic distance, and y axis is phenotypic distance) of a pair of isolates. As the color goes from blue to yellow, the number of isolates at a particular point on the plot increases. No significant correlation exists between genetic and phenotypic distances. The Left corresponds to the 10,000× condition for the clinical isolates using a SNP approach to strain definition (P value = 0.59). The Center corresponds to the 10,000× condition for the clinical isolates using a MLST definition of strain identity (P value = 0.49). The Right corresponds to environmental isolates, taxonomic order Bacillales, using a SNP approach to strain definition (P value = 2.7 × 10⁻⁷). (C) Correlation between phenotypic distances. Each point in the density plot is defined as the phenotypic distance comparison (between growth dynamics of growth conditions) of a pair of isolates. As the color goes from blue to yellow, the number of isolates at a particular point on the plot increases. Here, CAR refers to the carbenicillin growth condition. A significant correlation exists between pairs of phenotypes for the clinical isolates.

