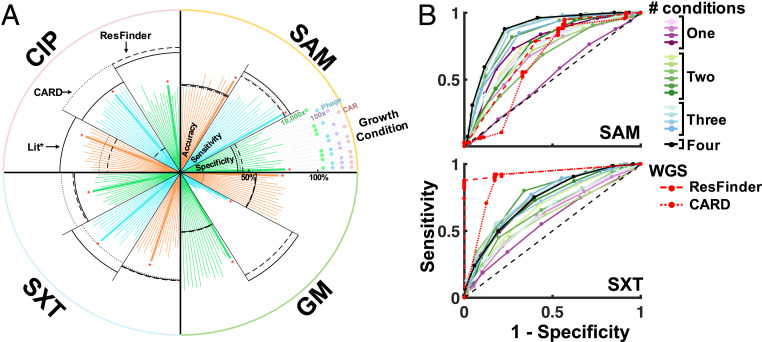
Fig. 5.
Antibiotic resistance prediction. (A) Growth dynamics can predict antibiotic resistance. We predict antibiotic resistance profiles for four antibiotics. Each line going outward from the center represents the strength of the mapping for one of three metrics: accuracy, sensitivity, or specificity. Each quarter of the circle represents the predictions for one of four antibiotics. The black lines within each slice correspond to WGS-based predictions using three databases: 1) the literature, 2) CARD, and (3) ResFinder. The black asterisk refers to literature. The red asterisks highlight the condition at which the best prediction occurs based on the highest value for the average of accuracy, sensitivity, and specificity. (B) Evaluation of resistance prediction. We compare ROC curves for the phenotype-based predictions and genotype-based predictions (red).

