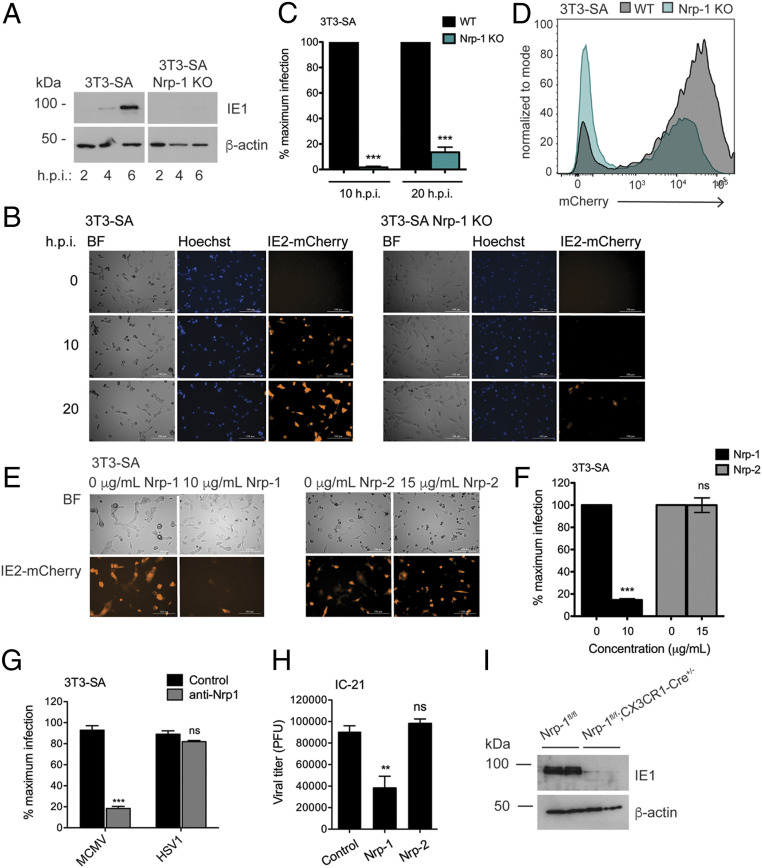
Fig. 4.
Nrp-1 mediates MCMV infection of multiple cell types. (A) Western blot for viral immediate early gene expression in 3T3-SA cells. (B) Fluorescence microscopy for IE2-mCherry expression. Cells were infected in triplicate at MOI 1 with MCMV IE2-mCherry in media containing 2 μM Hoechst and imaged with a Cytation 5 Imaging Reader every hour for 24 h. Shown are representative images. (C) Quantification of mCherry+ cells from B. (D) Cells were infected as in B and red fluorescence quantified after 20 h by flow cytometry. (E) Fluorescence microscopy for IE2-mCherry expression. MCMV IE2-mCherry was incubated with soluble recombinant Nrp-1, Nrp-2, or media alone for 1 h at 37 °C before being added to WT SVEC4-10 and 3T3-SA cells in triplicate at MOI 1. Cells were imaged 20 h postinfection with a Cytation 5 Imaging Reader. (F) Quantification of mCherry+ cells from E. (G) Infection rates in the presence of anti-Nrp-1 antibody. The 3T3-SA cells cultured in coverslips were preincubated with anti-Nrp1 antibody (4 μg/mL) for 30 min and then infected for 6 h with MCMV or HSV-1 (MOI 10). The percentage of infected cells was assessed by staining for IE1 (MCMV) or ICP0 (HSV-1). (H) Quantification of viral attachment at the cell surface in the presence of soluble neuropilins. MCMV was incubated with soluble recombinant Nrp-1, Nrp-2, or media alone for 1 h before being added to IC-21 cells in triplicate at MOI 1 and incubated for 30 min at 4 °C. Cells were harvested, and unbound virions washed away. The amount of adhered virus was then quantified by plaque assay. Significance was determined by using a one-way ANOVA with Dunnett’s multiple comparisons test. (I) Western blot for IE1 expression in BMDMs lacking Nrp-1 and infected with MCMV (MOI 1) for 6 h. BMDMs were generated from two mice per genotype and treated with 2 μM 4-hydroxy-tamoxifen for 7 d to induce Cre activity. All microscopy data were quantified by taking the average from four images. At least, two replicates were performed per experiment. Error bars indicate SEM. Significance was determined using a Student’s t test unless otherwise stated (***P < 0.0001, **P < 0.001).

