Fig. 2.
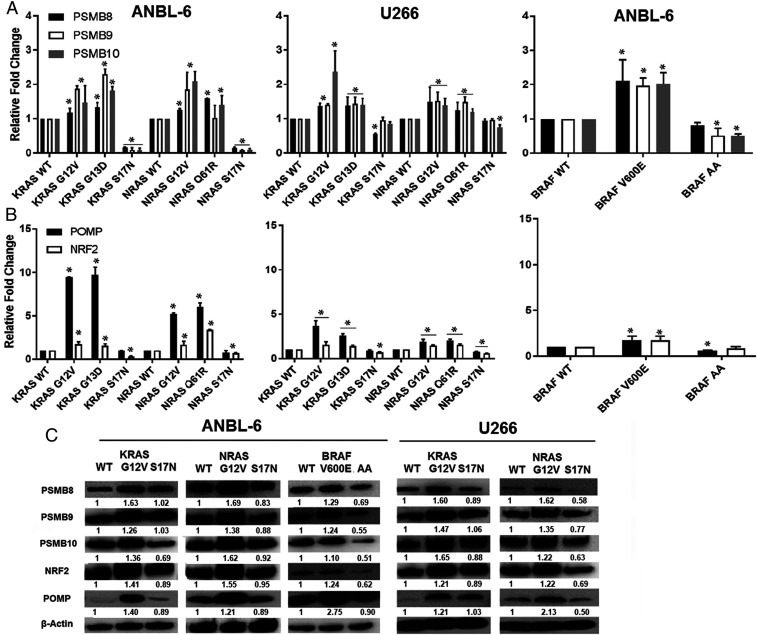
CA KRAS, NRAS, and BRAF increase NRF2, POMP, and PSMB8-10. PSMB8, PSMB9, and PSMB10 mRNAs were assessed by qRT-PCR in cells expressing RAS and BRAF mutants (A). Data are representative of three independent experiments, presented as mean ± SD of triplicates, and asterisks indicate P ≤ 0.05 versus the WT controls. POMP and NRF2 expression were then evaluated in these same cell lines by qPCR (B). Lysates from ANBL-6 (Left) and U266 cells (Right) expressing MAPK pathway mutants were analyzed for POMP, NRF2, PSMB8, PSMB9, and PSMB10 levels (C).

