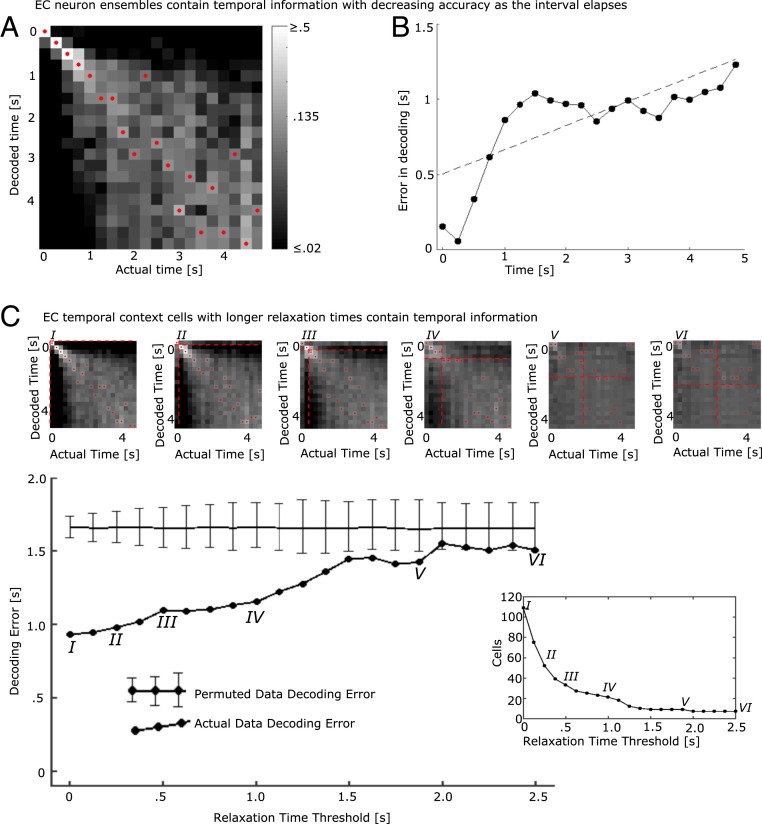
Fig. 3.
The population of entorhinal neurons encodes time with decreasing accuracy as the interval elapses. An LDA decoder was trained to decode time since presentation of the image and then tested on excluded trials. (A) Decoder performance trained on the entire population of EC neurons. The x axis indicates the actual time bin that the LDA attempted to decode; the y axis indicates the decoded time; and the shading indicates the log of the posterior probability, with lighter shading for higher probabilities (see color bar). The decoded time with the highest posterior for each actual time is marked with a red dot. The increasing spread of the diagonal and increasing dispersion of the red dots toward the lower right of the figure suggest that decoding accuracy decreases with the passage of time. (B) Decoding error increases with the passage of time. The x axis gives the actual time since image onset; the y axis gives the mean of the absolute error produced by the decoder in A. The dotted black line is a fitted regression line. The absolute error increases with the passage of time. (C) The temporal code was distributed along many temporal context cells, including those with slow relaxation times. The LDA decoder was first trained with the entire population of temporal context cells. To determine how the temporal code was distributed across the population of temporal context cells, we reran the classifier but only allowing neurons with progressively longer Relaxation Times to contribute to the analysis. For a Relaxation Time threshold of zero, all temporal context cells were included in the analysis, leading to results very comparable with the entire population (point labeled I). Then, the Relaxation Time threshold was increased from zero. For each value of the threshold, only temporal context cells with Relaxation Times greater than or equal to the Relaxation Time threshold were included in the analysis. The large line graph in Lower shows absolute error averaged over all time bins as a function of Relaxation Time threshold. Heat maps showing the entire posterior distribution for selected points labeled by Roman numerals are shown in Upper (same color bar and convention as in A). The threshold for Relaxation Time for each of the heat maps is shown as dashed red lines. Note the earlier times that were most accurate (0 to 0.75 s) dropped substantially in accuracy as the faster Relaxation Times were removed from the analysis. The horizontal line in the main line graph shows the absolute error in decoding from a permuted dataset; error bars show the 0.025 and 0.975 quantiles. (Lower Right) The number of temporal context cells remaining in the analysis as a function of Relaxation Time threshold. The gradual decline in accuracy suggests that temporal information was distributed smoothly throughout the population of temporal context cells.

