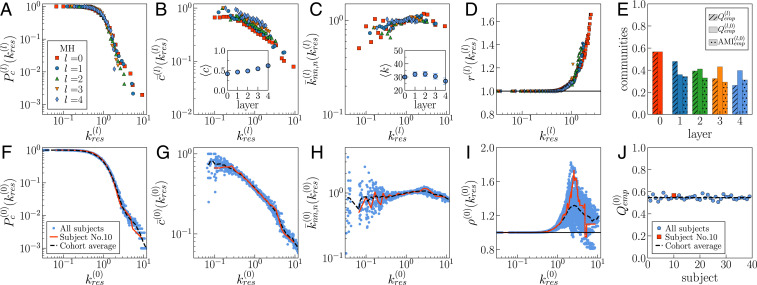
Fig. 2.
Self-similarity of the MH connectome across different resolutions. (A–E) Results for UL subject no. 10. (A) Complementary cumulative degree distribution . (B) Degree-dependent clustering coefficient . (B, Inset) Average clustering coefficient across layers. (C) Normalized average degree of nearest neighbors . (C, Inset) Average degree across layers. In B and C, Insets, error bars indicate the two-SE interval around the mean; note that some of the bars are smaller than symbols. (D) Rich-club coefficient for low and intermediate values of the rescaled threshold degrees. (E) Community structure. is the modularity in layer , is the modularity that the community structure of layer induces in layer 0, and is the adjusted mutual information between the latter and the community partition directly detected in layer 0; Materials and Methods. The subscript indicates the empirical MH connectome. (F–J) Variability of topological properties in the UL dataset. Blue symbols correspond to the properties of layer 0 for each of the 40 subjects. The red lines correspond to UL subject no. 10. The black dashed line represents the average value across the 40 subjects in the cohort. Degrees have been rescaled by the average degree of the corresponding layer .

