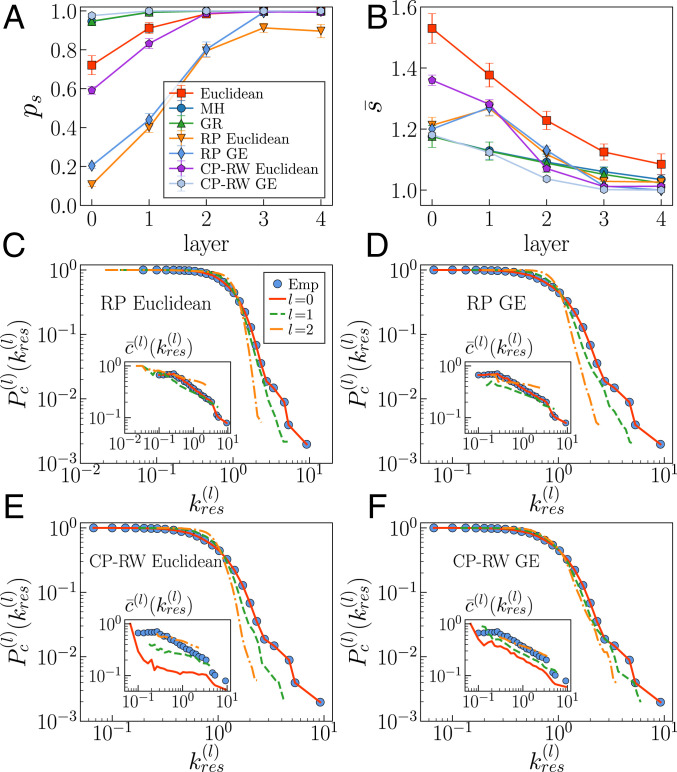
Fig. 6.
Navigability of the MH connectomes and the GR shells at different resolutions. (A and B) Average success rate (A) and average stretch (B) for all UL subjects. Navigation performance was benchmarked against four different random null models. The error bars show the CI around the expected values. (C–F) The loss of self-similarity in the four ensembles of random null models can be seen through the loss of self-similarity of their complementary cumulative degree distribution and degree-dependent clustering coefficient (Insets) (see SI Appendix, Figs. S18 and S19 for more results). For each null model, we generated 100 multiscale surrogates for UL subject no. 10.

