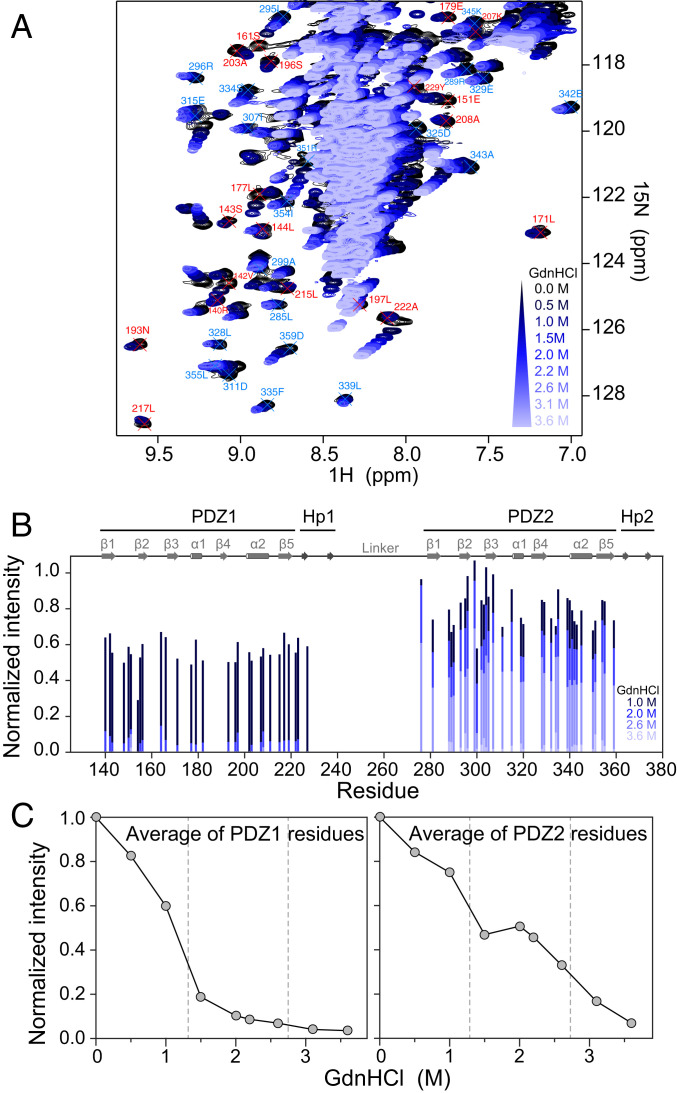
Fig. 2.
Chemical denaturation of pP1-P2 followed by NMR. (A) Region of 1H-15N HSQC spectra recorded on 15N-labeled pP1-P2 at increasing GdnHCl concentrations from 0 (black) to 3.6 M (light blue). Unambiguous assignment of isolated peaks is indicated in red for PDZ1 and in blue for PDZ2. (B) Normalized peak intensities for each unambiguously assigned residue plotted at 1, 2, 2.6, and 3.6 M GdnHCl from dark to light blue. Domains of pP1-P2 and secondary structure elements are indicated at the top. (C) Average of the normalized peak intensities plotted as a function of GdnHCl concentration for PDZ1 (Left) and PDZ2 (Right) residues, highlighting the denaturation midpoints measured for PDZ1 and PDZ2, 1.3 M and 2.7 M GdnHCl, respectively.

