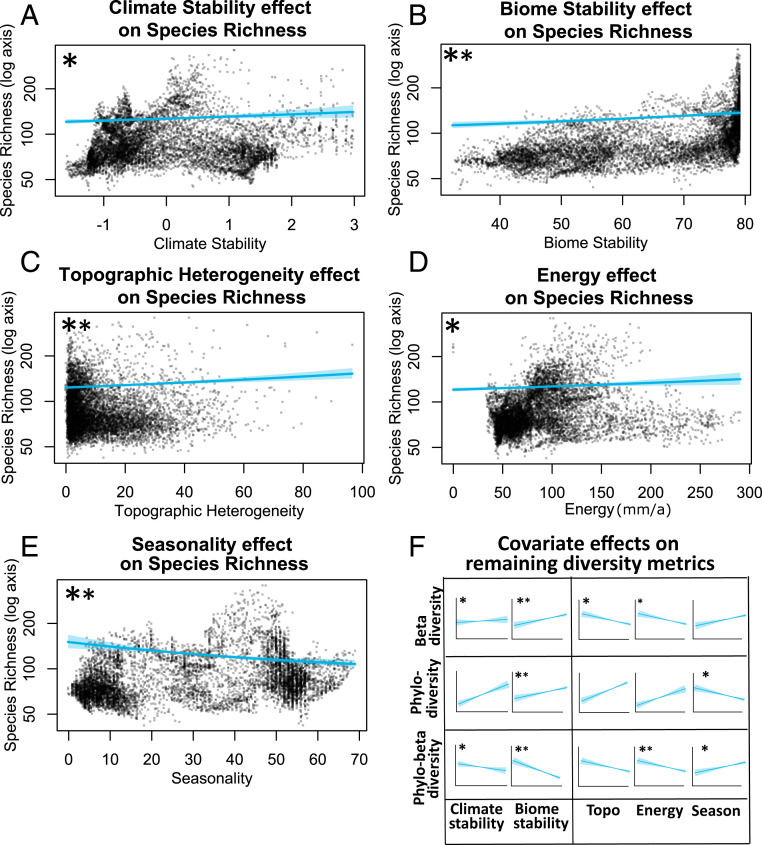
Fig. 4.
(A–E) Relationships between species richness predicted from models with (A) climate stability, (B) biome stability, (C) topographic heterogeneity, (D) energy, and (E) seasonality. (F) Simplified plots of the relationship of these covariates with the remaining diversity variables controlling for species richness (species turnover, phylogenetic diversity, and phylogenetic beta diversity; see SI Appendix, Fig. S4 for detailed plots). Within each plot, the results are shown with the median estimate and 95% confidence intervals (shaded). Confidence intervals are computed from models that include all fixed and spatially explicit random effects: The presence of strong spatial effects generates wider scatter in the points than may be expected from plotted confidence intervals. A large asterisk indicates well-supported effects with confidence intervals that exclude 0; a small asterisk indicates that models excluding a specific covariate received more support from wAIC statistics than a full model including all covariates. For example, excluding climate stability or energy received more support from wAIC statistics than the full model, suggesting the positive effects of biome stability and topographic heterogeneity and the negative effects of seasonality on species richness are the most robust.

