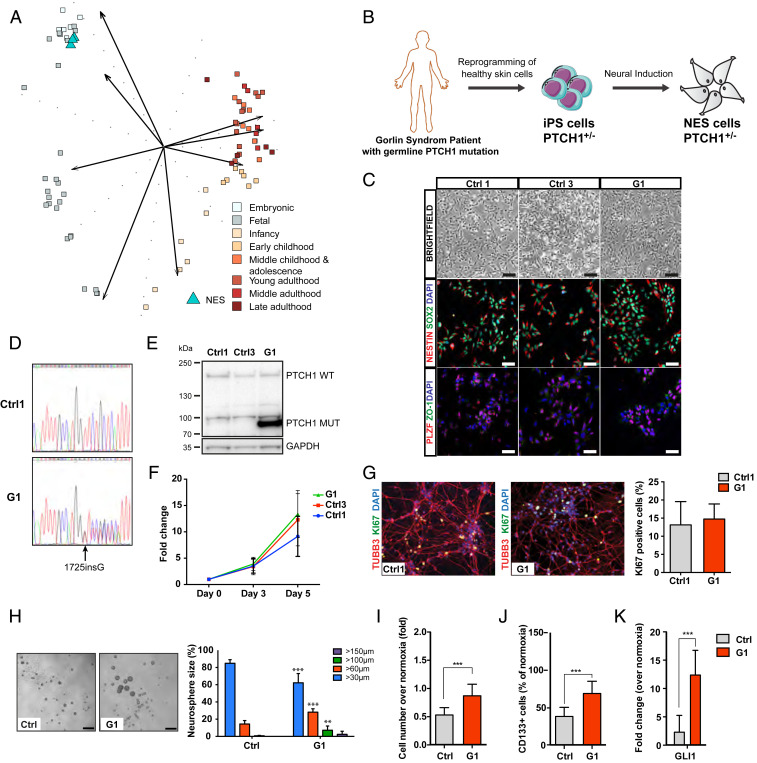
Fig. 1.
Characterization of NES cells with germline PTCH1 mutation derived from a Gorlin syndrome patient. (A) Comparing transcriptome of normal NES cells with cerebellar developmental stages ranging from embryonic (combined cerebellar cortex and upper rhombic lip), and fetal to late adulthood (cerebellar cortex) using PCA. NES cells (n = 3) show strongest similarity to the embryonic group (4 ≤ Age < 8 post conceptual weeks). (B) Schematic showing generation of NES cells from G1 Gorlin syndrome patient. (C) NES cells organize in rosette-like structures (Top, Scale bar, 200 µm), expressed neural stem cell markers NESTIN and SOX2 (Middle), and rosette markers PLZF and ZO-1 (Bottom), (Scale bar, 100 µm.) (D) Sanger DNA sequencing showed both wild-type and mutated alleles of PTCH1 gene in G1 (1762insG) NES cells. (E) Western blot of both WT and truncated (Mut) forms of PTCH1 protein in G1 NES cells. (F) Proliferation rate of Ctrl1, Ctrl3, and G1 NES cells, evaluated by cell counting. Mean ± SD, n = 3 independent experiments. (G) After 14 d of differentiation, Ctrl1 and G1 NES cells differentiate to neurons as shown by TUBB3 staining. KI67-positive cells were quantified and normalized to 4′,6-diamidino-2-phenylindole dihydrochloride (DAPI)-positive nuclei and presented as mean ± SD, n = 3 independent experiments, n.s, not significant. (H) G1 NES cells formed larger neurospheres compared to control NES cells, bar 250 µm. Histogram shows percentage distribution of neurospheres by size. Mean ± SD, n = 3 to 6 independent experiments, one-way ANOVA with Dunnett correction, ***P ≤ 0.001, **P ≤ 0.01. (I) G1 NES cells had higher cell numbers compared to control NES cells in hypoxia. Data are expressed as fold over cell number in normoxia. Mean ± SD, n = 3 independent experiments, ***P ≤ 0.001, Student t test. (J) CD133 Flow cytometry analysis showing that G1 NES cells had significantly higher number of CD133-positive cells compared to control NES cells in hypoxia. Data are expressed as percentage of CD133-positive cells out of live cells. Mean ± SD, n = 3 independent experiments, ***P ≤ 0.001, Student t test. (K) qRT-PCR analysis of GLI1 expression in hypoxia relative to normoxia. Data are shown as mean ± SD, n = 3 independent experiments. ***P ≤ 0.001, Student t test.

