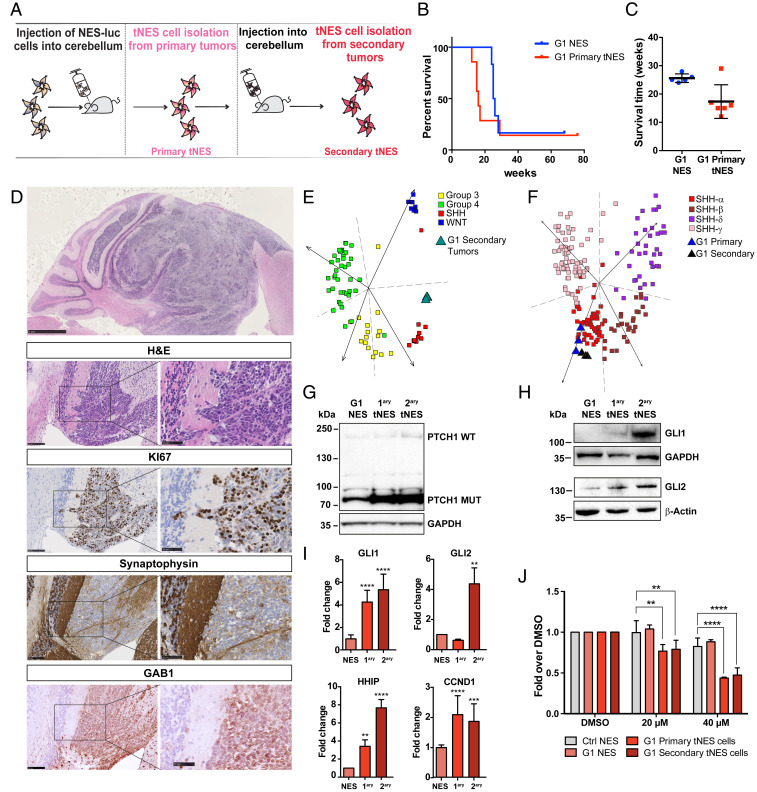
Fig. 3.
Isolated tumor cells show accelerated tumor formation and tumor progression in vivo. (A) Schematic overview of isolation and reinjection of tNES cells forming tumors in secondary hosts. (B) Shortened tumor onset was observed for mice injected with primary tNES (G1luc#14, n = 7) cells compared to those that were injected with the parental line, G1luc (n = 6). (C) Histogram showing significant reduced time of tumor onset in tumor-bearing mice injected with primary tNES compared to parental G1 NES. *P ≤ 0.05, Student t test. (D, Top) Representative H&E staining of tumors arising from orthotopic transplantation of primary tNES cells, (scale bar, 1 mm). (Lower) Cerebellar tumor sections were stained for H&E, proliferation marker KI67, neural marker synaptophysin, and SHH-subgroup marker GAB1, (Left) (scale bar, 100 µm), (Right) (scale bar, 50 µm). (E) PCA showing G1 secondary tNES cells grouped with human SHH-subgroup in the spread of the four medulloblastoma subtypes based on metagene signatures. (F) PCA showing G1 primary and secondary tNES grouped with human SHH-alpha subgroup in the spread of the four SHH subtypes based on metagene signatures. (G) Western blot of both WT and truncated (Mut) forms of PTCH1 protein in G1 NES and tNES cells. (H) Western blot of GLI1 and GLI2 protein expression in G1 NES and tNES cells (G1, G1luc#14, G1luc#14_40). (I) Gene expression analysis using qRT-PCR showing relative fold mRNA expression of GLI1, GLI2, HHIP1, CCND1 in G1 NES and tNES cells. Data are shown as mean ± SD, n = 3 biological replicates, **P ≤ 0.01, ***P ≤ 0.001, ****P ≤ 0.0001, Student t test. (J) Resazurin assay showing decreased viability in primary and secondary G1 tNES cells on Vismodegib treatment. Mean ± SD, n = 3 independent experiments, **P ≤ 0.01, ****P ≤ 0.0001, two-way ANOVA with Dunnett correction.

