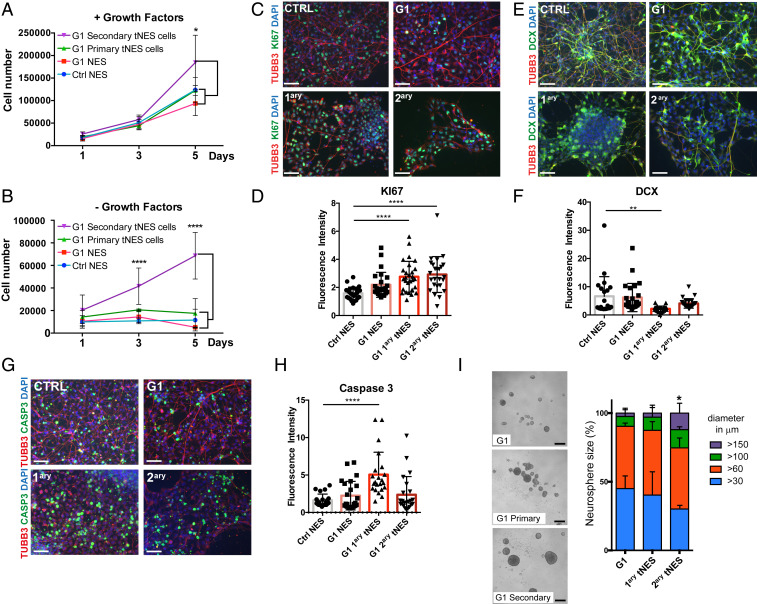
Fig. 4.
Gorlin tNES cells show an increase in proliferation and a decrease in neural differentiation. (A and B) Proliferation of Ctrl3 NES, G1 NES, G1 primary tNES cells (G1luc#14), and G1 secondary tNES cells (G1luc#14_40) in the presence or absence of EGF and FGF2 for 5 d was analyzed by cell counting. Mean ± SD, n = 3 independent experiments, *P ≤ 0.05, ****P ≤ 0.0001, two-way ANOVA with Tukey correction. (C) Immunofluorescence analysis of KI67 (green) expressing cells after 7 d in differentiating condition, (Scale bar, 50 μm.) (D) Quantification of KI67-positive signal measured by fluorescence intensity normalized to DAPI-positive cells. Mean ± SD, ****P ≤ 0.0001, Student t test. (E) Immunofluorescence analysis of DCX (green) expressing cells after 7 d in differentiating condition, (Scale bar, 50 μm.) (F) Quantification of DCX-positive signal measured by fluorescence intensity normalized to DAPI-positive cells. Mean ± SD, **P ≤ 0.01, Student t test. (G) Immunofluorescence analysis of cleaved Caspase 3 (green) expressing cells after 7 d in differentiating condition, (scale bar, 50 μm.) (H) Quantification of cleaved Caspase 3-positive signal measured by fluorescence intensity normalized to DAPI-positive cells. Mean ± SD, ****P ≤ 0.0001 Student t test. (I) G1 primary (G1luc#14) and secondary tNES cells (G1luc#14_40) formed larger neurospheres compared to the parental G1 NES cells after 6 d in culture, (scale bar, 250 µm). Histogram show percentage distribution of neurospheres by sizes of parental, primary, and secondary tumor cells, n = 4 to 6 independent experiments, *P ≤ 0.05 for secondary tumor cells neurospheres >150 µm diameter compared to parental cells, one-way ANOVA with Dunnett correction.

