Fig. 5.
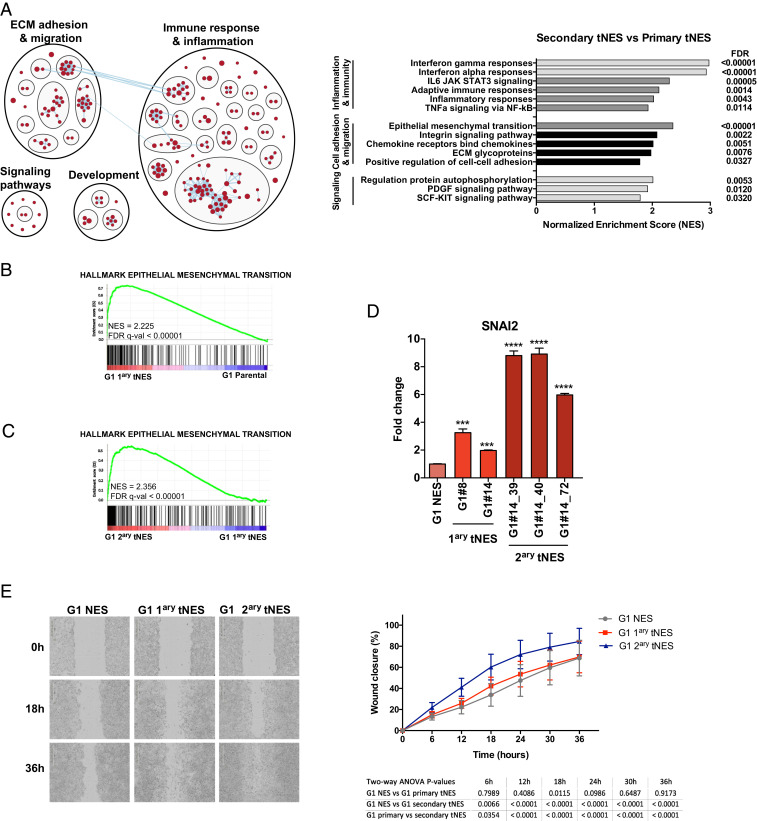
Progressive activation of inflammatory and migratory pathways during tumor development. (A, Left) Enrichment map generated by Broad Institute GSEA tool (FDR < 0.05) and visualized by Cytoscape EnrichmentMap and AutoAnnotate application, showing biological pathways enriched in G1 secondary tNES cells compared to primary NES cells. Red nodes represent up-regulated biological pathways. (Right) Histogram of most significantly deregulated pathways in G1 secondary tNES compared to primary G1 tNES. (B) Enrichment plot showing over-representation of genes involved in EMT in G1 primary tNES compared to G1 parental NES. (C) Enrichment plot showing over-representation of genes involved in EMT in G1 secondary tNES tumors compared to G1 primary tNES. (D) Gene expression analysis by qRT-PCR showing increasing levels of SLUG (SNAI2) in G1 primary and secondary tNES compared to parental NES cells. Data are shown as mean ± SD, n = 3 biological replicates, **P ≤ 0.01, ***P ≤ 0.001, ****P ≤ 0.0001, Student t test. (E) Increased migration rate of G1 secondary tNES cells (G1luc#14_40) compared to primary tNES (G1luc#14) and parental G1 NES cells was observed in wound closure assay. Mean ± SD, combining three independent experiments. Statistical analysis by two-way ANOVA with Tukey correction is presented in a table below the graph.

