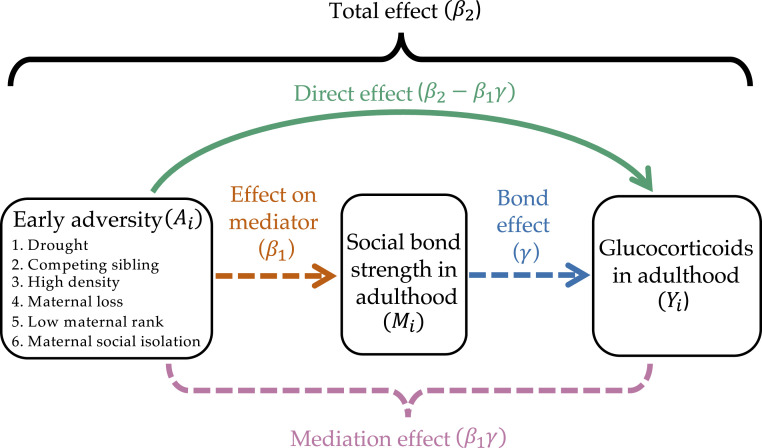
Fig. 2.
Visual representation of the modeling framework used to test the relationships among early adversity, social bond strength, and glucocorticoid (GC) concentrations. Mediation models provide estimates of the total effect, or “global” relationship between early adversity and GCs , which are subdivided into estimates of the mediation effect and direct effect . , the relationship between early adversity and social bond strength is the effect (of early adversity) on the mediator (the dashed orange arrow), while is the bond effect (i.e., the effect of weak social bonds on adult GC concentrations, independent of early adversity; this is the dashed blue arrow). Collectively, the effect on the mediator and the bond effect make up the mediation effect, encompassed by the pink bracket. The colors of the arrows in the diagram correspond to the colors of the column headings in the results tables; for example, the green direct effect arrow is the pathway represented in the green direct effect column in Tables 2 and 3. The dashed arrows represent the causal pathways captured by the dashed mediation effect bracket. The colors in this figure also correspond to the visual representation of these effects in Figs. 3 and 4. Information on our sources of early adversity can be found in Table 1, and information on measuring social bond strength and GC concentrations can be found in Materials and Methods.

