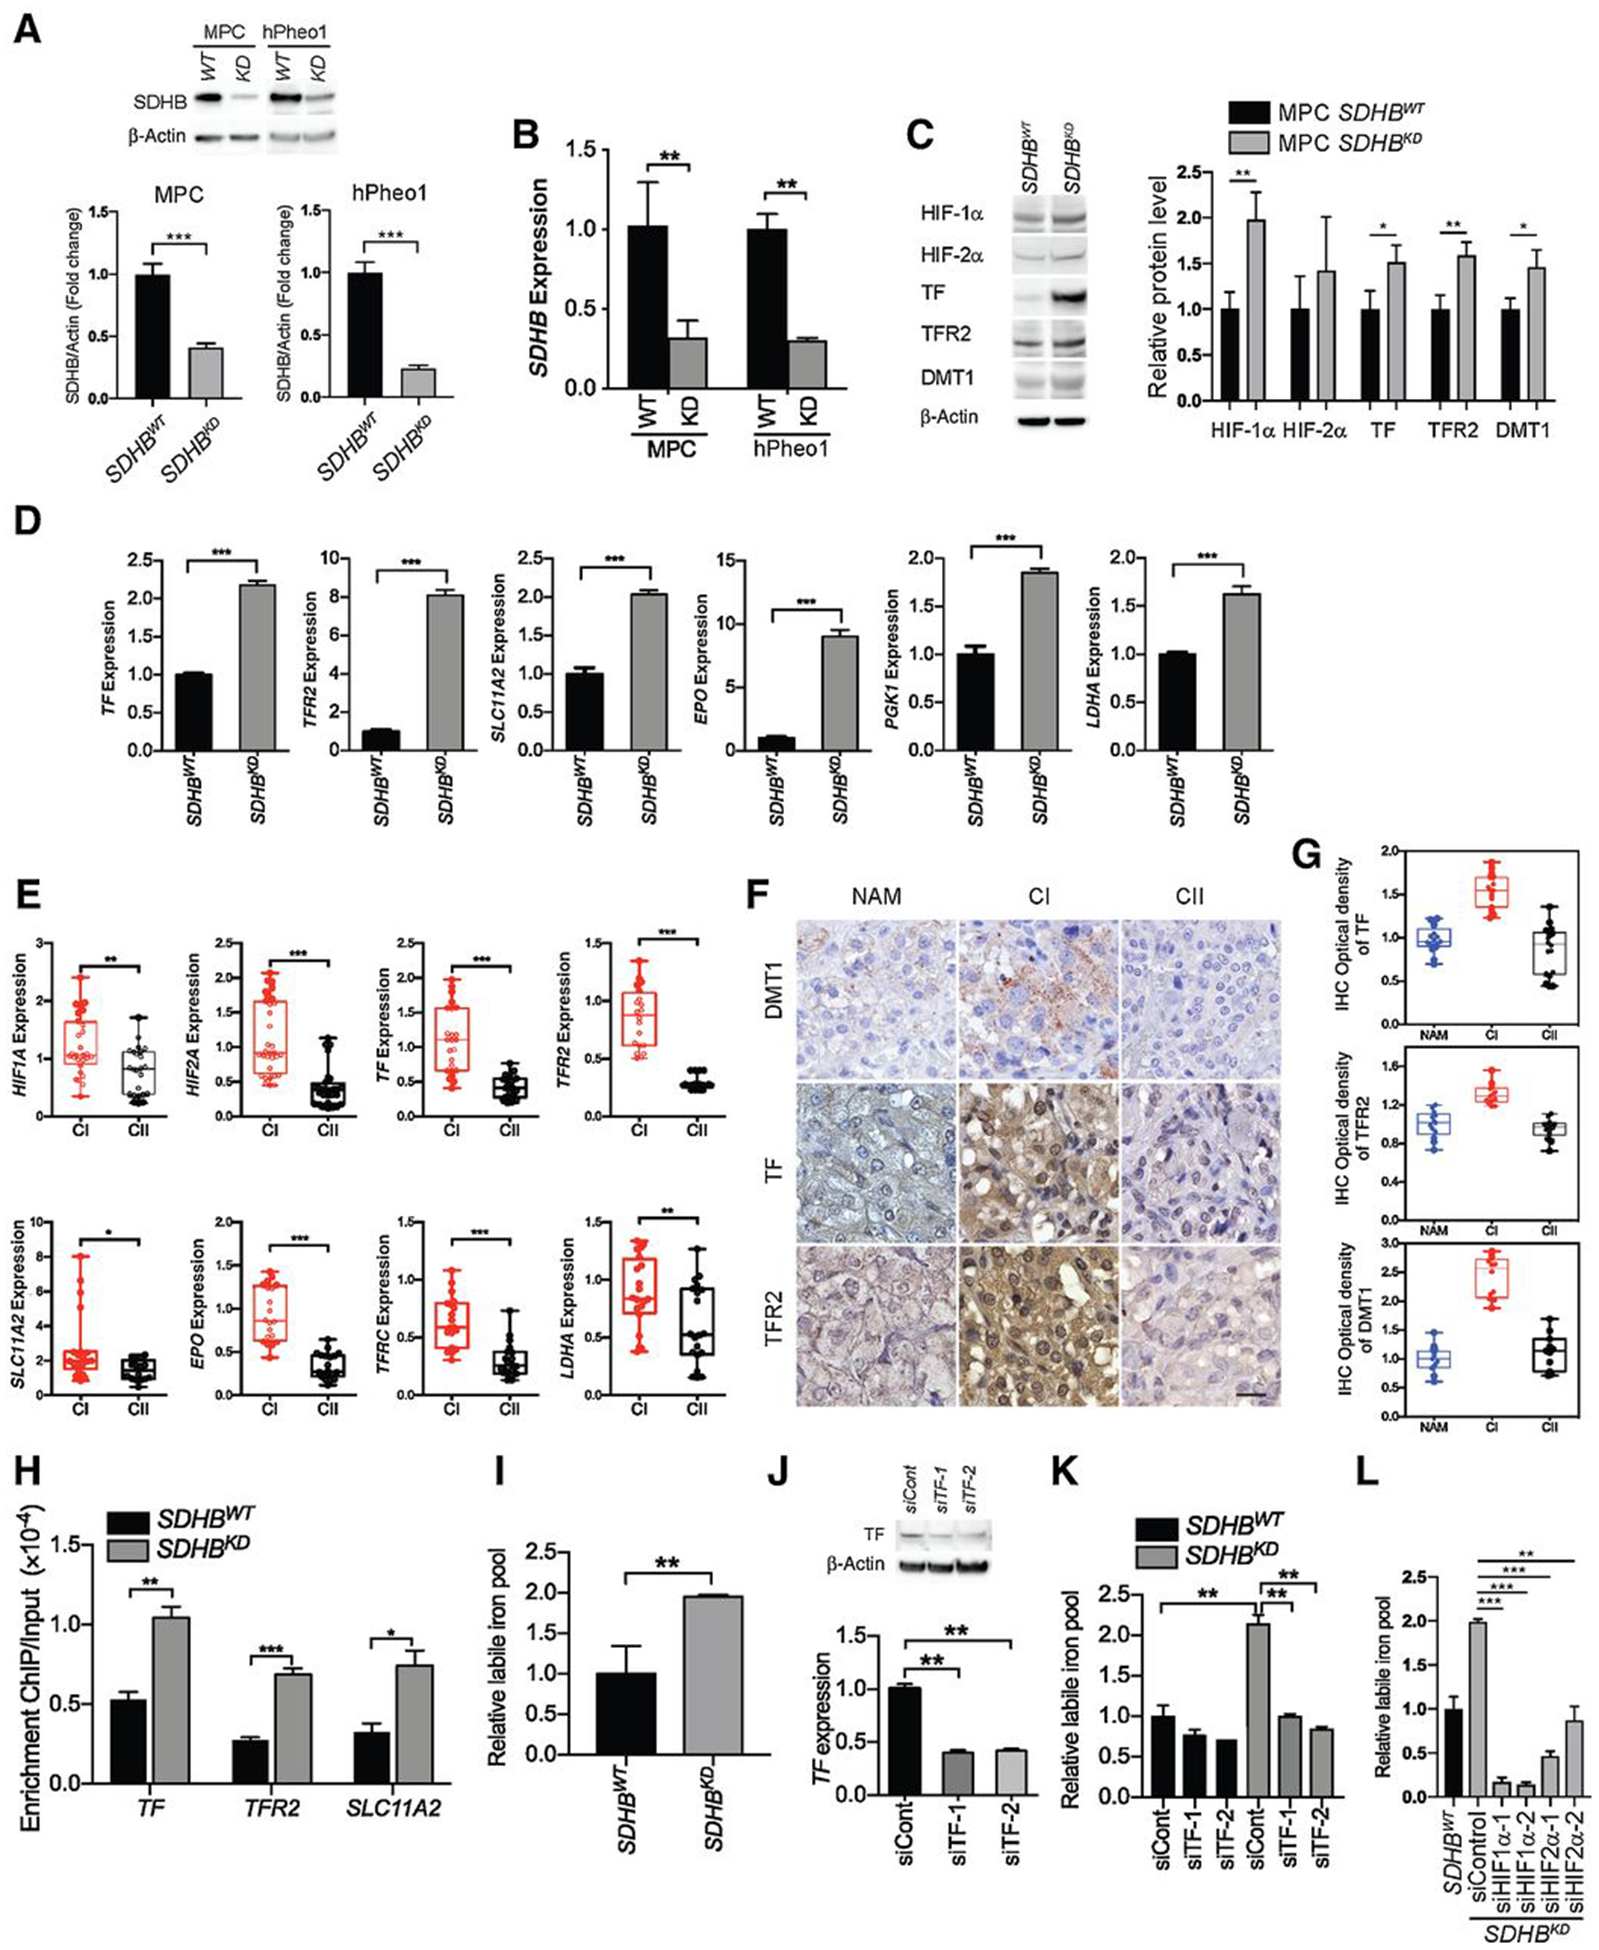
Figure 1.

SDHB deficiency induces pseudohypoxia and reprograms iron homeostasis. A, SDHB knockdown efficiency in mouse pheochromocytoma (MPC) and hPheo1 cell lines was measured by Western blot analysis (top) and quantification (bottom, n = 3). β-actin was used as a loading control. B, SDHB knockdown efficiency in MPC and hPheo1 cell lines was measured by qRT-PCR (n = 4). C, HIF-1α, HIF-2α, TF, TFR2, and DMT1 proteins in SDHBWT and SDHBKD MPC cells were measured by Western blot analysis (left) and quantification (right, n = 3). β-actin was used as a loading control. D, Levels of TF, TFR2, SLC11A2 (DMT1), EPO, PGK1, and LDHA mRNA were measured by qRT-PCR. Data normalized to SDHBWT. E, Levels of HIF1A, HIF2A, TF, TFR2, SLC11A2, EPO, TFRC, and LDHA mRNA in cluster I and cluster II PCPG frozen tissues were measured by qRT-PCR. CI, cluster I (n = 5–8); CII, cluster II (n = 4–7). F, Expression of DMT1, TF, and TFR2 in cluster I (n = 4) and cluster II (n = 5) PCPGs was measured by IHC staining obtained from cluster I and cluster II PCPG FFPE tissues. Scale bar, 50 μm. CI, cluster I; CII, cluster II; NAM, normal adrenal medulla. G, Integrated optical density quantification of the IHC staining shown in (F). Cluster I (CI), n = 4; cluster II (CII), n = 5. H, Promoter affinity of HIF-1α assay in SDHBWT and SDHBKD hPheo1 cells was measured by a ChIP PCR assay. I, The level of the labile iron pools in SDHBWT and SDHBKD mouse pheochromocytoma cells was measured by a cellular labile iron pool quantification assay. J, Knockdown efficiency of siRNA targeting TF in mouse pheochromocytoma cells was measured by Western blot analysis (top) and qRT-PCR (bottom). K, The level of the labile iron pools in SDHBWT and SDHBKD mouse pheochromocytoma cells after TF knockdown was measured by a cellular labile iron pool quantification assay. L, The level of the labile iron pools in SDHBKD mouse pheochromocytoma cells after HIF1A and HIF2A knockdown was measured by a cellular labile iron pool quantification assay. All significance in differences were determined by t test [*, P < 0.05; **, P < 0.01; ***, P < 0.001 (±SEM)].
