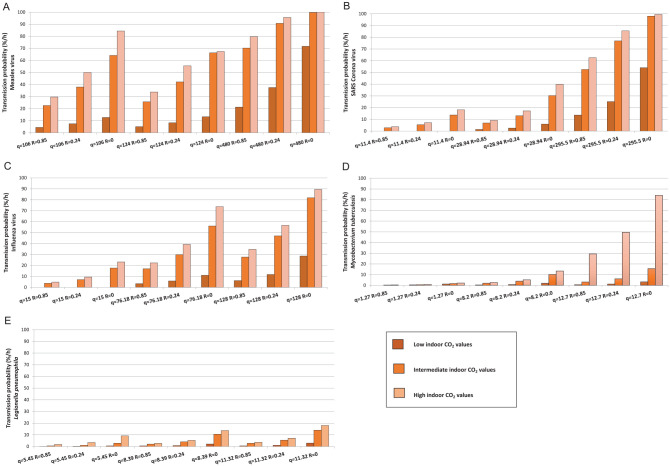
Figure 1.
The probability of infection transmission of measles virus (A), severe acute respiratory syndrome (SARS) coronavirus (B), influenza virus (C), Mycobacterium tuberculosis (D), and Legionella pneumophila (E). The bars represent the indoor carbon dioxide concentrations, indicative for the level of ventilation. The values for q represent the 3 levels of patient infectivity, while the R values stand for the 3 levels of personal protection.

