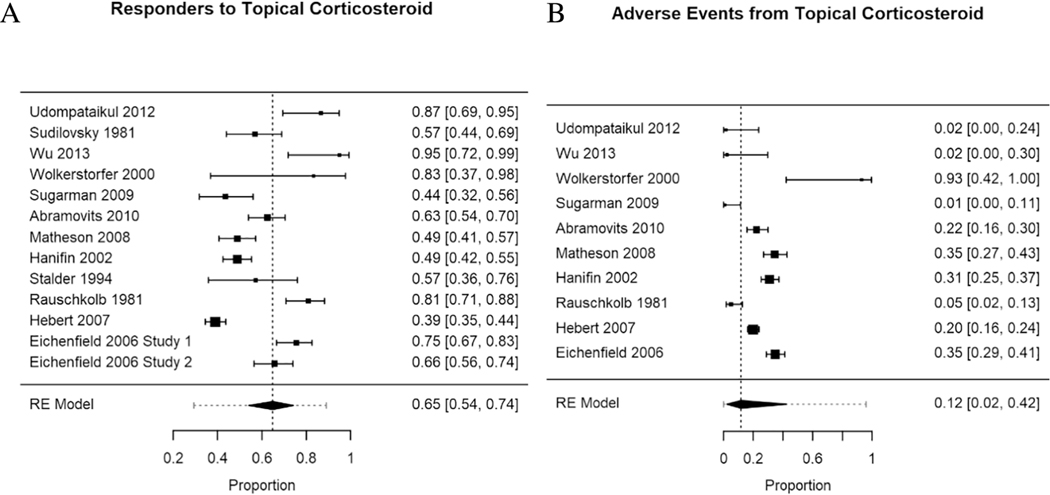
Figure 2.
Forest plot of proportions by study (solid square is the mean proportion), number on the right. 95% confidence interval (CI) represented by bars on graph, summarized in brackets on the right. Larger squares represent more participants in the study. RE (Random-Effects Model) summarizes data from all studies, with the dashed vertical line displaying the overall proportion of responders/events from the aggregate data, and the horizontal dashed line representing the 95% CI across studies.

