
Figure 2. Recurrent alterations target KLF5 and ESRP1.
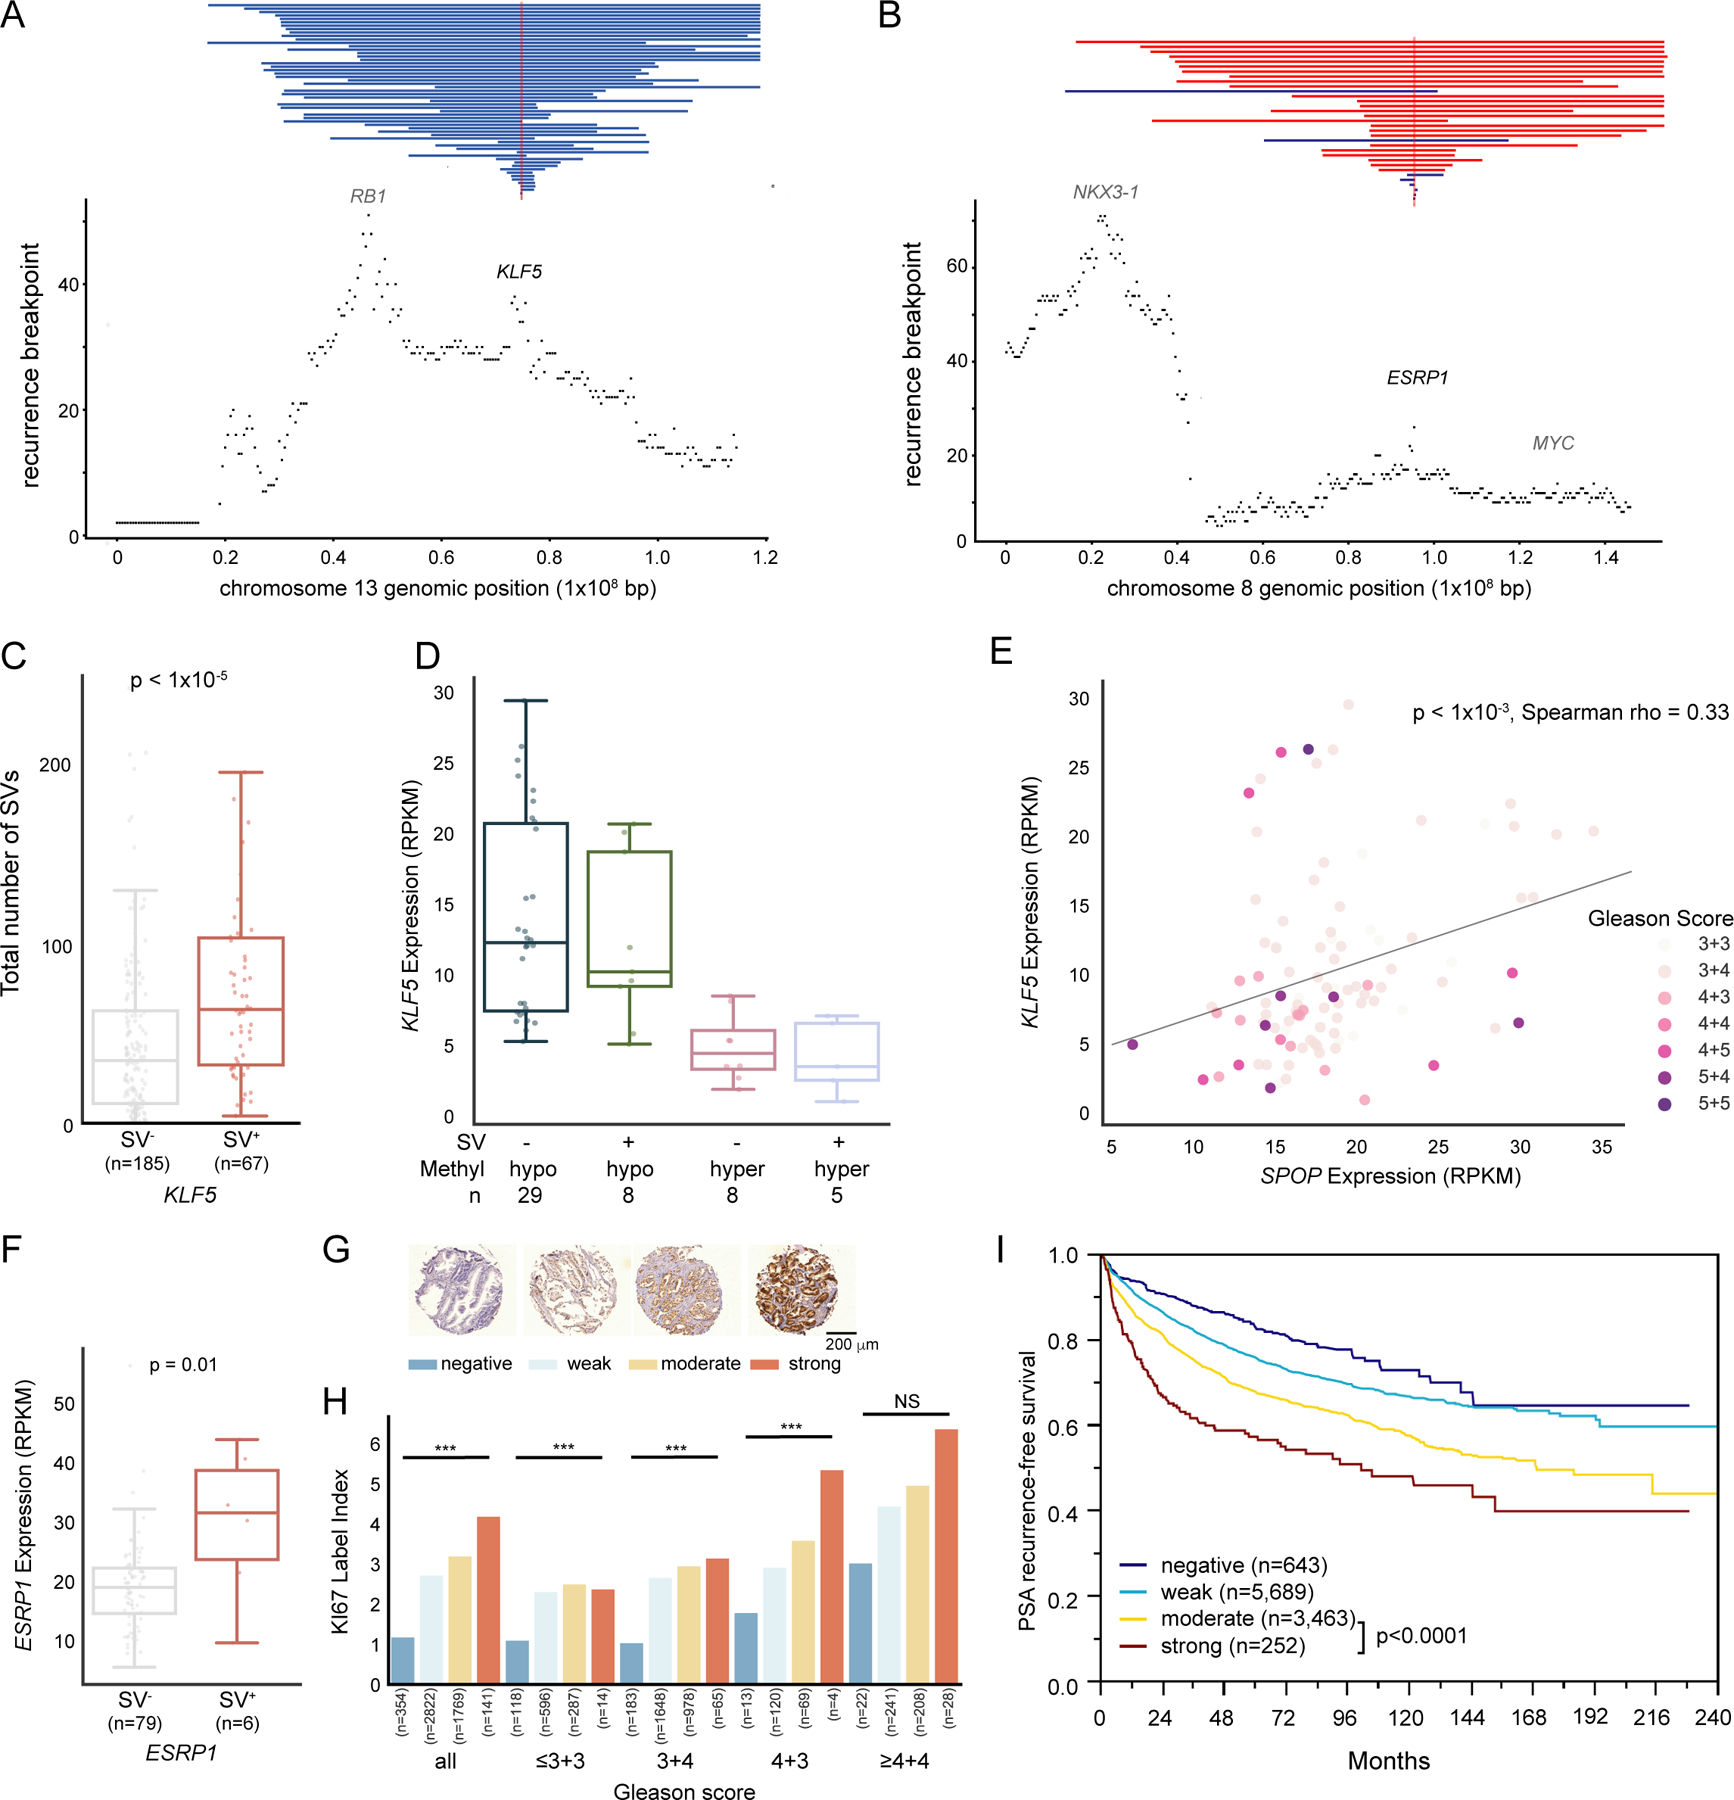
(A, B) SV recurrence plot at 13q22 (A) and 8q22 (B) with vertical red and blue lines represents genomic gain and loss, respectively (n tumor samples = 292). The smallest overlapping SV is shown in case of multiple SVs per tumor sample.
(C) Number of somatic SVs from our total cohort of tumors according to presence (SV+) or absence (SV−) of SVs affecting the KLF5 locus. MWU-based p value.
(D) KLF5 gene expression of different methylation and somatic SV states with x-axis representing KLF5 promoter-proximal methylation status and somatic SV states.
(E) Correlation between KLF5 and SPOP expression, with each dot representing a tumor, color-labeled with GS.
(F) Boxplot of ESRP1 mRNA expression separated by tumors with an SV gain of ESRP1 (SV+) and without (SV−). MWU-based p value.
(G) ESRP1 protein expression stained in 11,954 TMA samples and scored as “negative” (dark blue), “weak” (light blue), “moderate” (yellow) or “strong” (red).
(H) Barplot showing Ki67 labelling index separated by GS and ESRP1 staining. Number of tumors for each category is labelled below each bar. ***: p < 0.001, NS = not significant (a = 0.05). The colors of bars correspond to those in (G).
(I) Kaplan-Meier plot, showing PSA-recurrence-free survival for patients stratified by ESRP1 staining intensity.
Boxplots show median (line), upper and lower quartiles (boxes), and lines extending to 1.5 x IQR (whiskers).