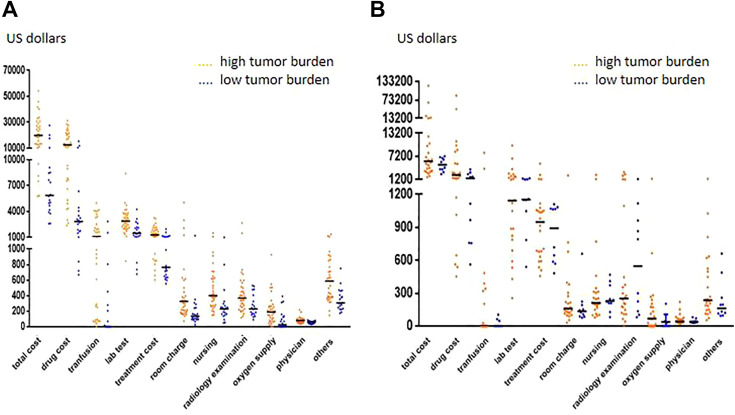
Fig. 3.
Comparison of costs between high and low tumor burden groups. (A) Comparison of costs between high and low tumor burdens in the ALL cohort (total cost, P < 0.001; drug cost, P < 0.001; transfusion, P < 0.001; lab test, P < 0.001; treatment cost, P < 0.001; room charge, P < 0.001; nursing, P < 0.001; radiology examination, P = 0.007; oxygen supply, P = 0.001; physician, P = 0.003; others, P < 0.001). (B) Comparison of costs between high and low tumor burdens in the NHL cohort (total cost, P > 0.05; drug cost, P > 0.05; transfusion, P > 0.05; lab test, P > 0.05; treatment cost, P > 0.05; room charge, P > 0.05; nursing, P > 0.05; radiology examination, P > 0.05; oxygen supply, P > 0.05; physician, P > 0.05; others, P > 0.05). ALL: acute lymphoblastic leukemia; NHL: non-Hodgkin’s lymphoma.

